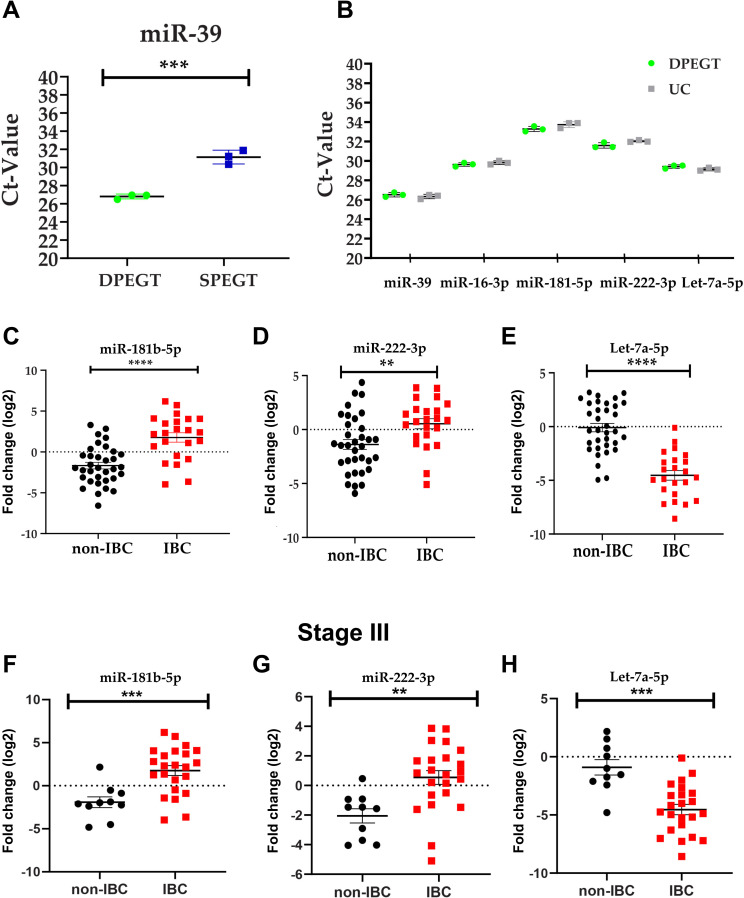
Fig 5. Expression levels of miR-181b-5p, miR-222-3p and let-7a-5p in enriched plasma sEVs.
Total RNA of sEVs isolated from patients with non-IBC and IBC, and normal volunteers was reverse transcribed into cDNA and miRNA expression levels were quantified using specific miRNAs primers. (a) Ct values of spike in miR-39. n = 3, *** p < 0.001 as determined by Student’s t-test. (b) Comparable Ct values of miR-39, miR-16-3p, miR-181b-5p, miR-222-3p, and let-7a-5p of enriched pooled plasma sEVs isolated by DPEGT and UC, n = 3. Relative expression levels of miR-181b-5p (c), miR-222-3p (d), and let-7a-5p (e) in enriched plasma sEVs isolated from IBC (n = 23) and non-IBC (n = 34) by DPEGT. **** p < 0.0001, ** p < 0.01 as determined by Student’s t-test. Relative expression levels of miR-181-5p (f), miR-222-3p (g) and let7-5p (h) in enriched plasma sEV isolated from stage III of both IBC (n = 23) and non-IBC (n = 10) by DPEGT. *** p <0.001, ** p < 0.01 as determined by Student’s t-test.

