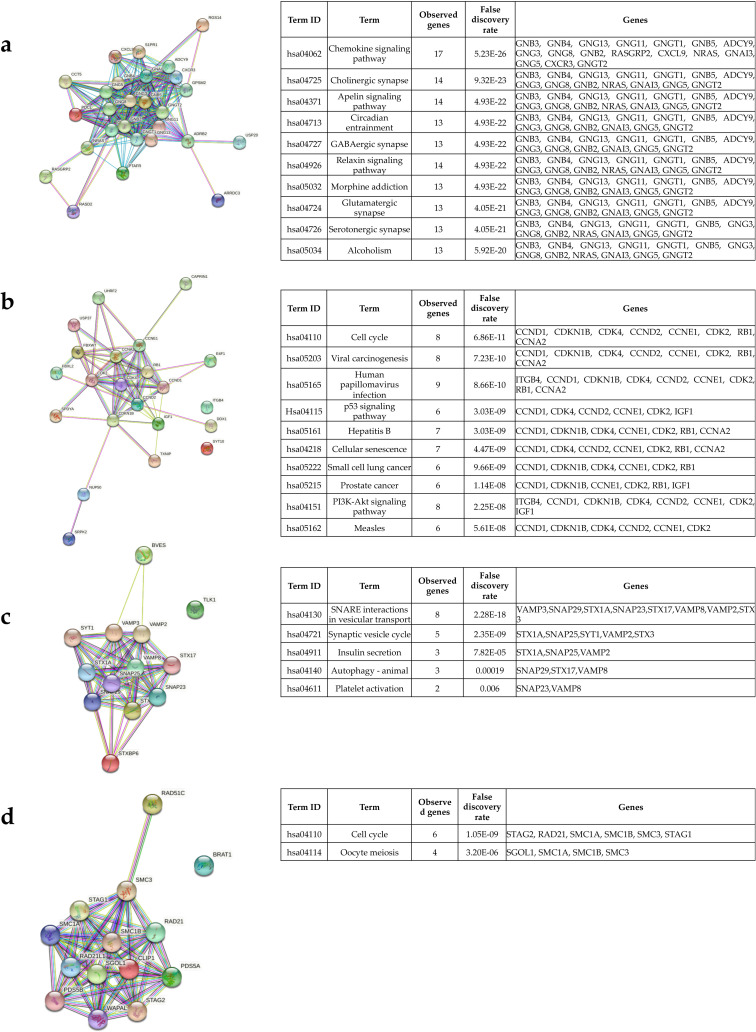
Fig 8. Hub genes protein‐protein interactions (PPI) and enrichment pathways.
To analyze the hub genes, present in most significant modules obtained from the Cytoscape plugin Molecular Complex Detection (MCODE) we used the String database. (a-d) shows the PPI network of the hub genes present in each module and the enrichment pathways associated to them. < 1.0E‐16 is the p‐value for the entire PPI network of each module. String performs the false discovery rate (FDR) for the statistics.

