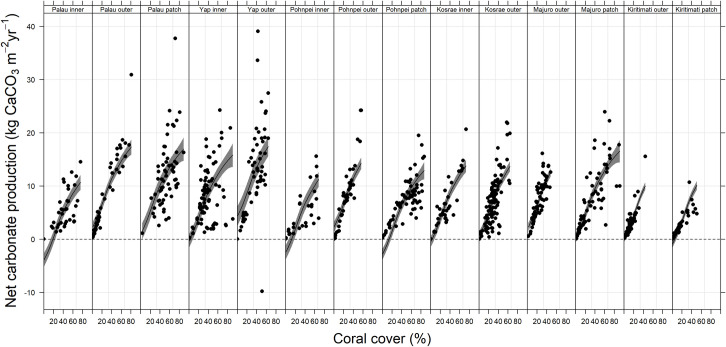
Fig 5. The relationship between the percentage (%) live coral cover and the net carbonate production rates (kg CaCO3 m-2 yr-1) for each habitat (i.e., inner, patch, and outer reefs) at each of the six Pacific Ocean study locations [i.e., at Palau and Yap (2017), Pohnpei and Kosrae (2018), and Majuro and Kiritimati (2019)].
The lines are best-fit generalized additive models, and the polygons display the standard errors.

