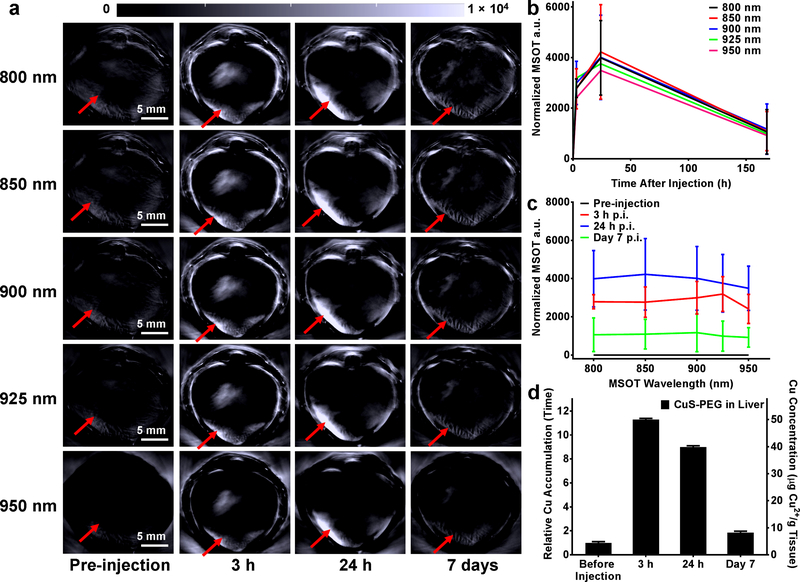
Figure 3.
In vivo degradation and MSOT of CuS-PEG nanoparticles in the liver. (a) Serial static transverse MSOT images were obtained under different wavelengths before intravenous injection and at different time points after intravenous injection of nanoparticles. The red arrows indicate the location of the liver. Region-of-interest (ROI) analyses were performed by comparing the liver signal after normalization (signal intensity at a certain time point – signal intensity before injection) at different wavelengths (b) and at different time points (c) (n = 3). (d) The MSOT results were validated by ICP-OES, which showed a decrease in Cu concentration in the liver (n = 3).

