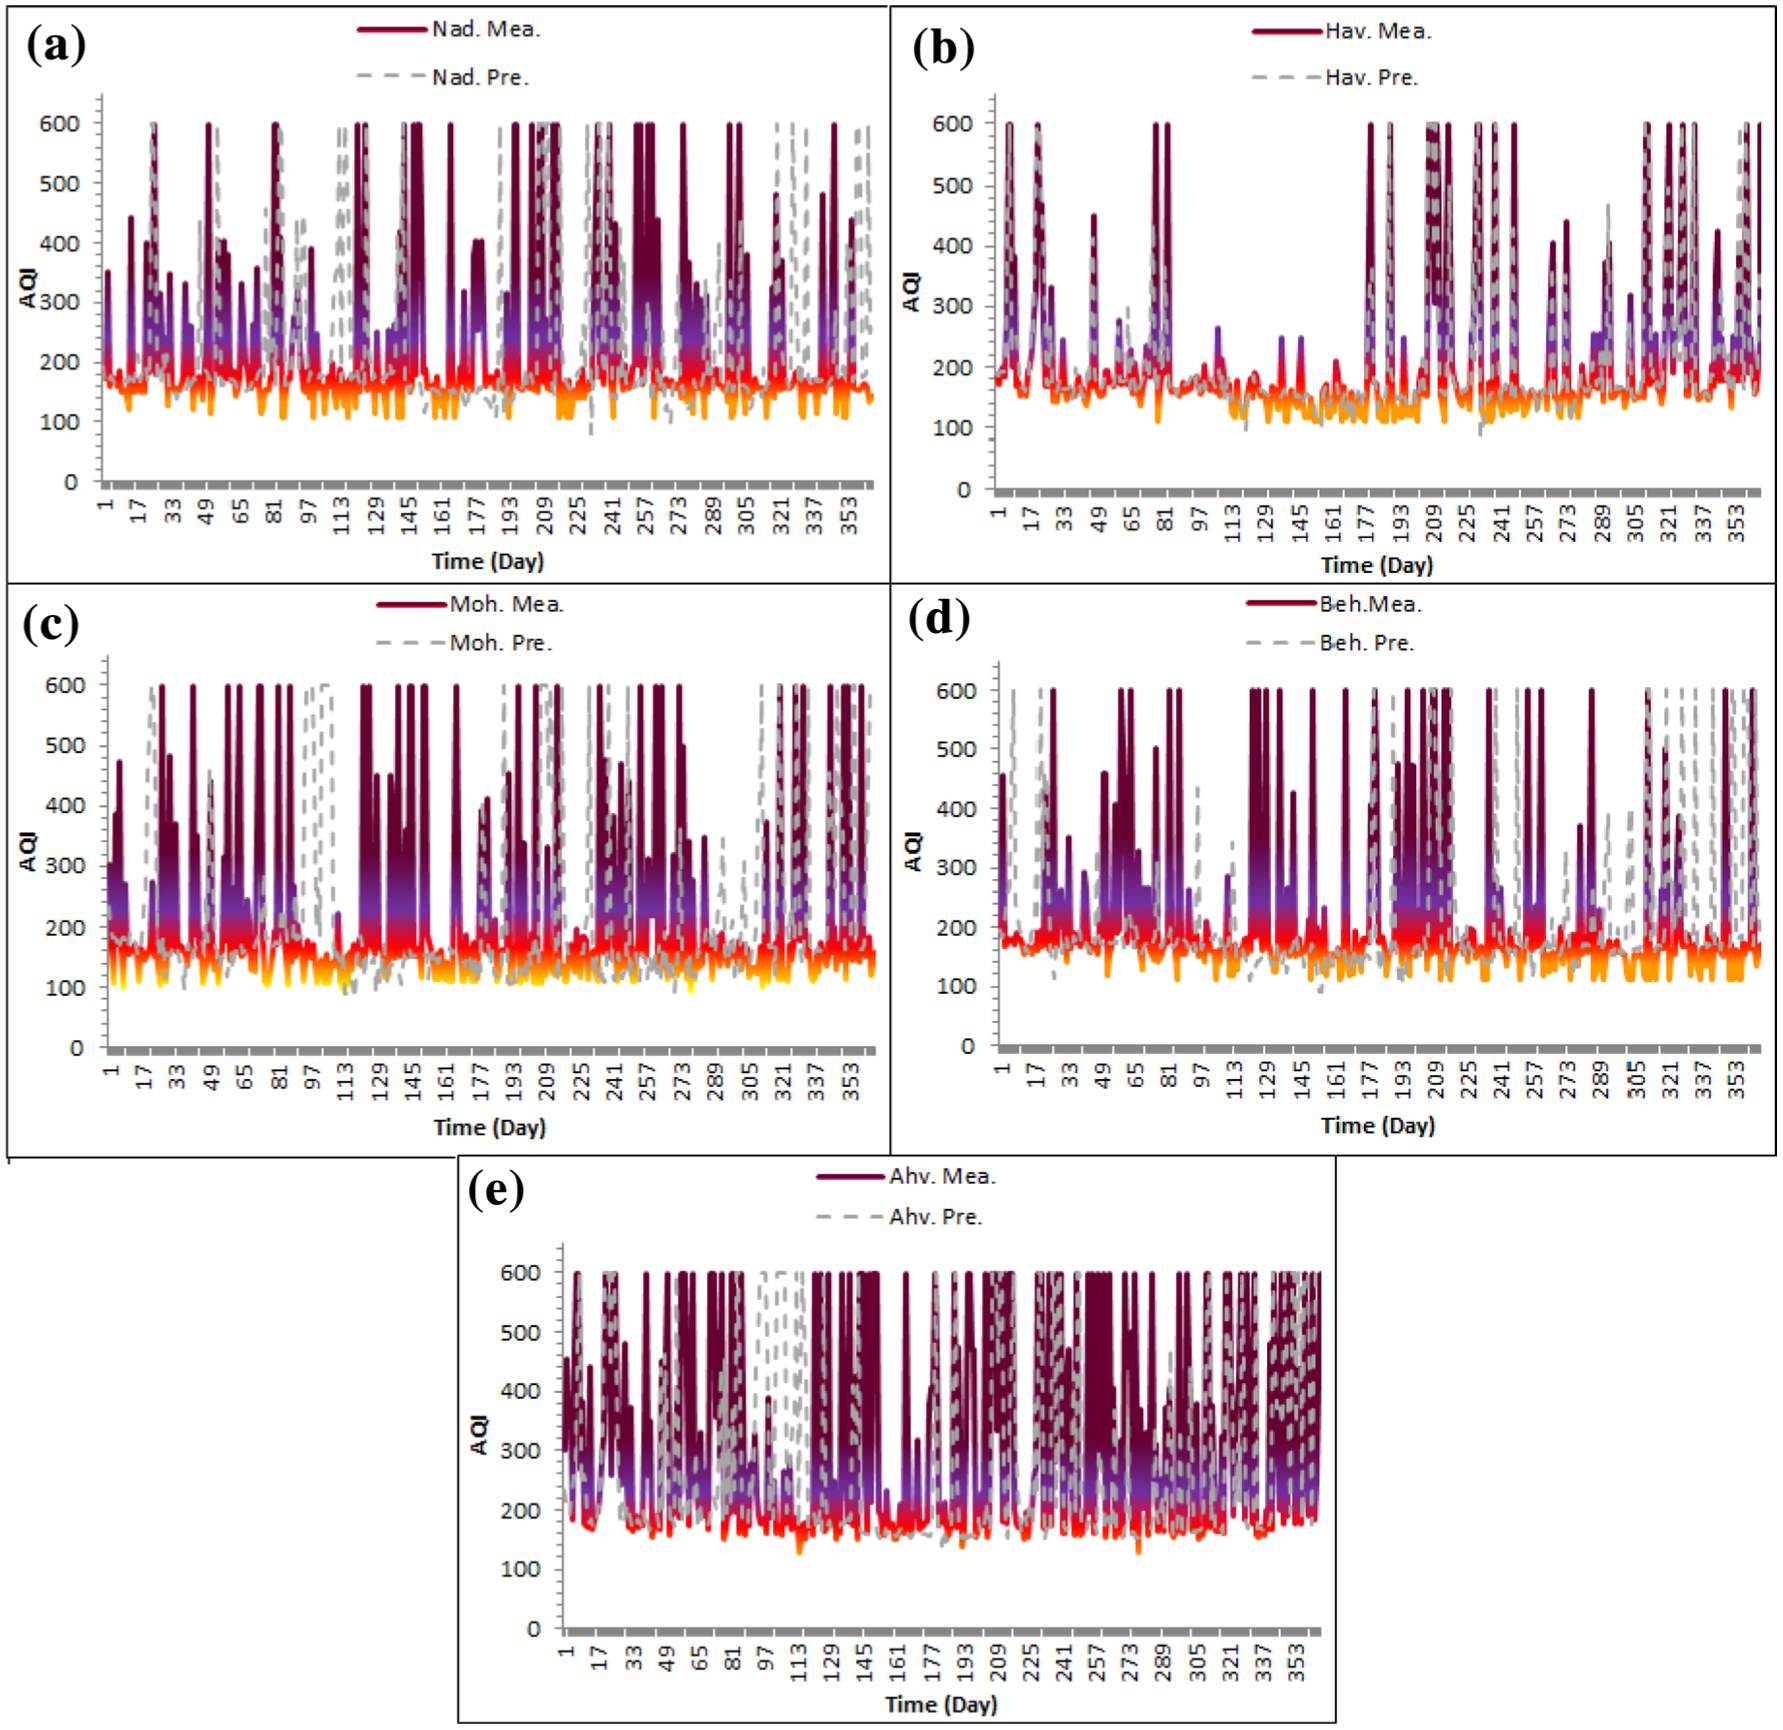
Fig. 6.

Time series of predicted and measured AQI for four air quality monitoring stations in Ahvaz, including all of them averaged, which is representative of the entire city of Ahvaz. Results are shown for the period between August 2009 and August 2010. Values are classified as good (0–50, green), moderate (51–100, yellow), unhealthy for susceptible groups (101–150, orange), unhealthy (151–200, red), very unhealthy (201–300, purple), and hazardous (> 301, Maroon)
