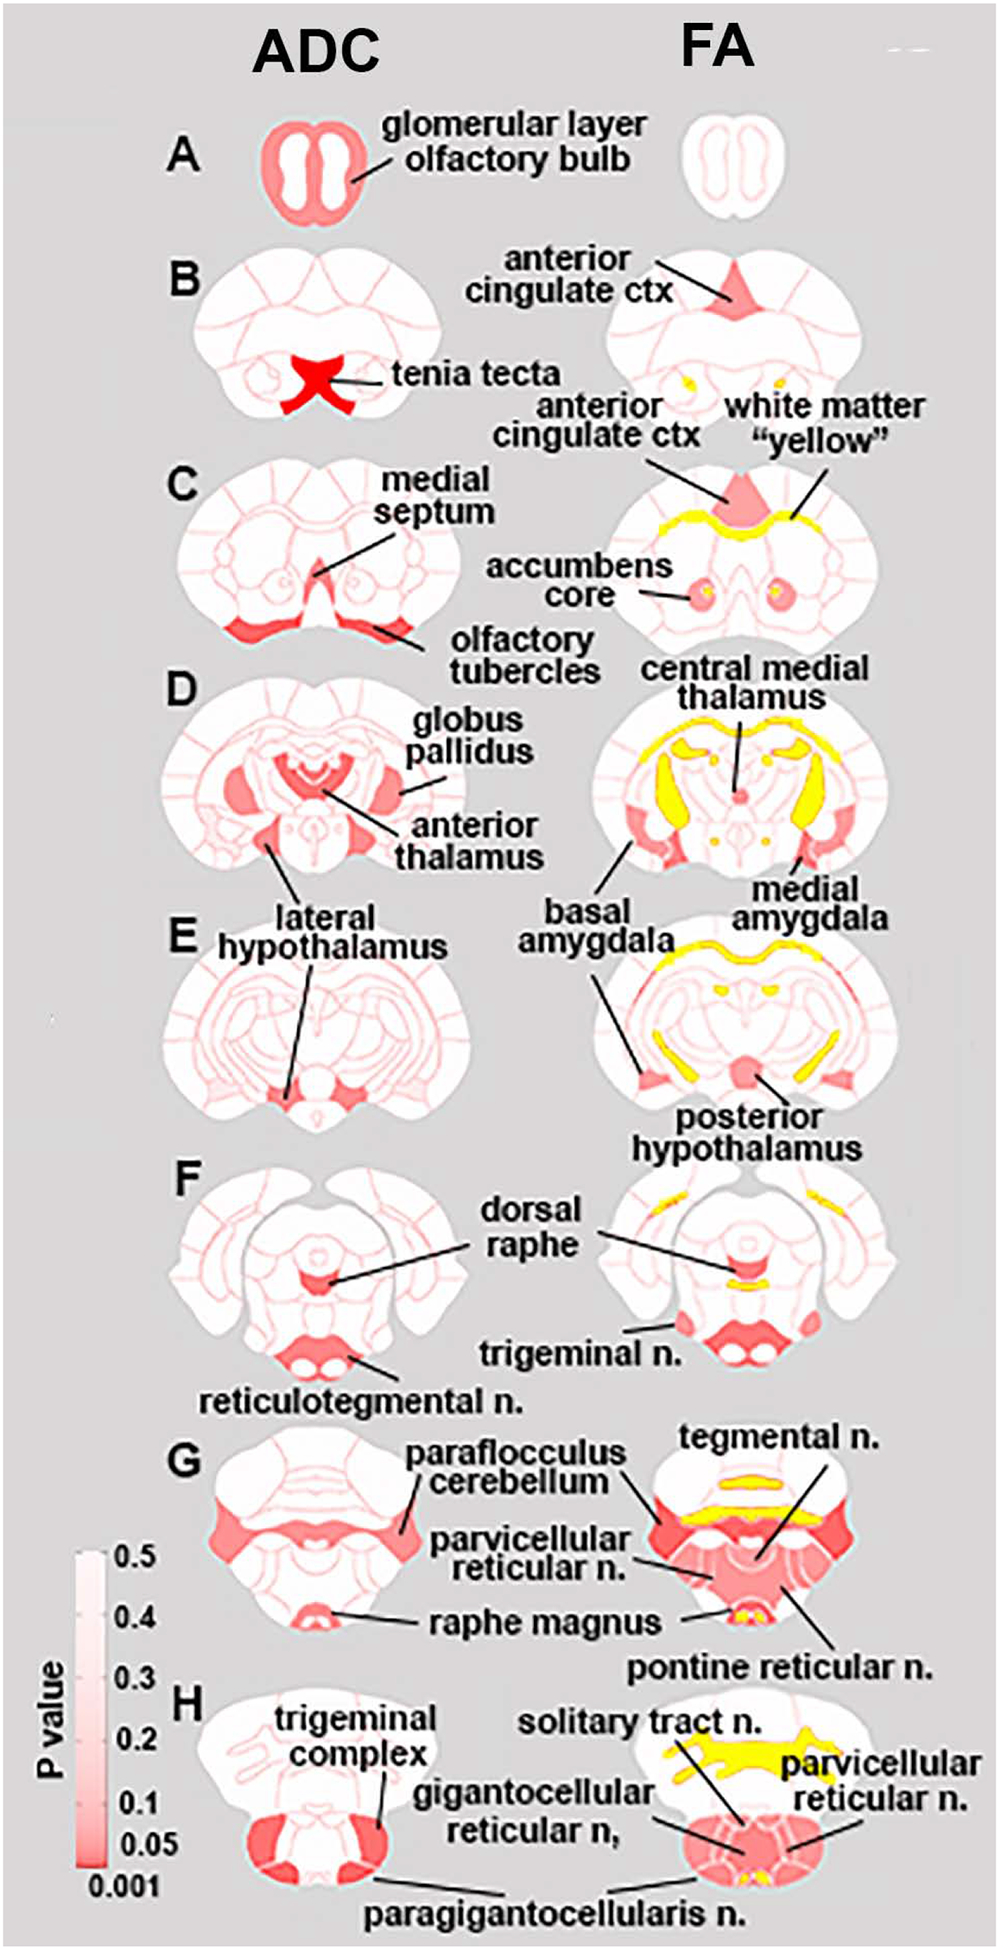
Figure 1.

Diffusion Weighted Imaging. Left hand column shows regions of significant differences in Apparent Diffusion Coefficients (ADC) between IL and KI males, while the right hand column indicates regions with significant differences in Fractional Anisotropy. P values (≤ .047 ADC, ≤ 0.045 FA) for brain regions are indexed by degree of red shading, while significant differences in white matter are indicated in yellow.
