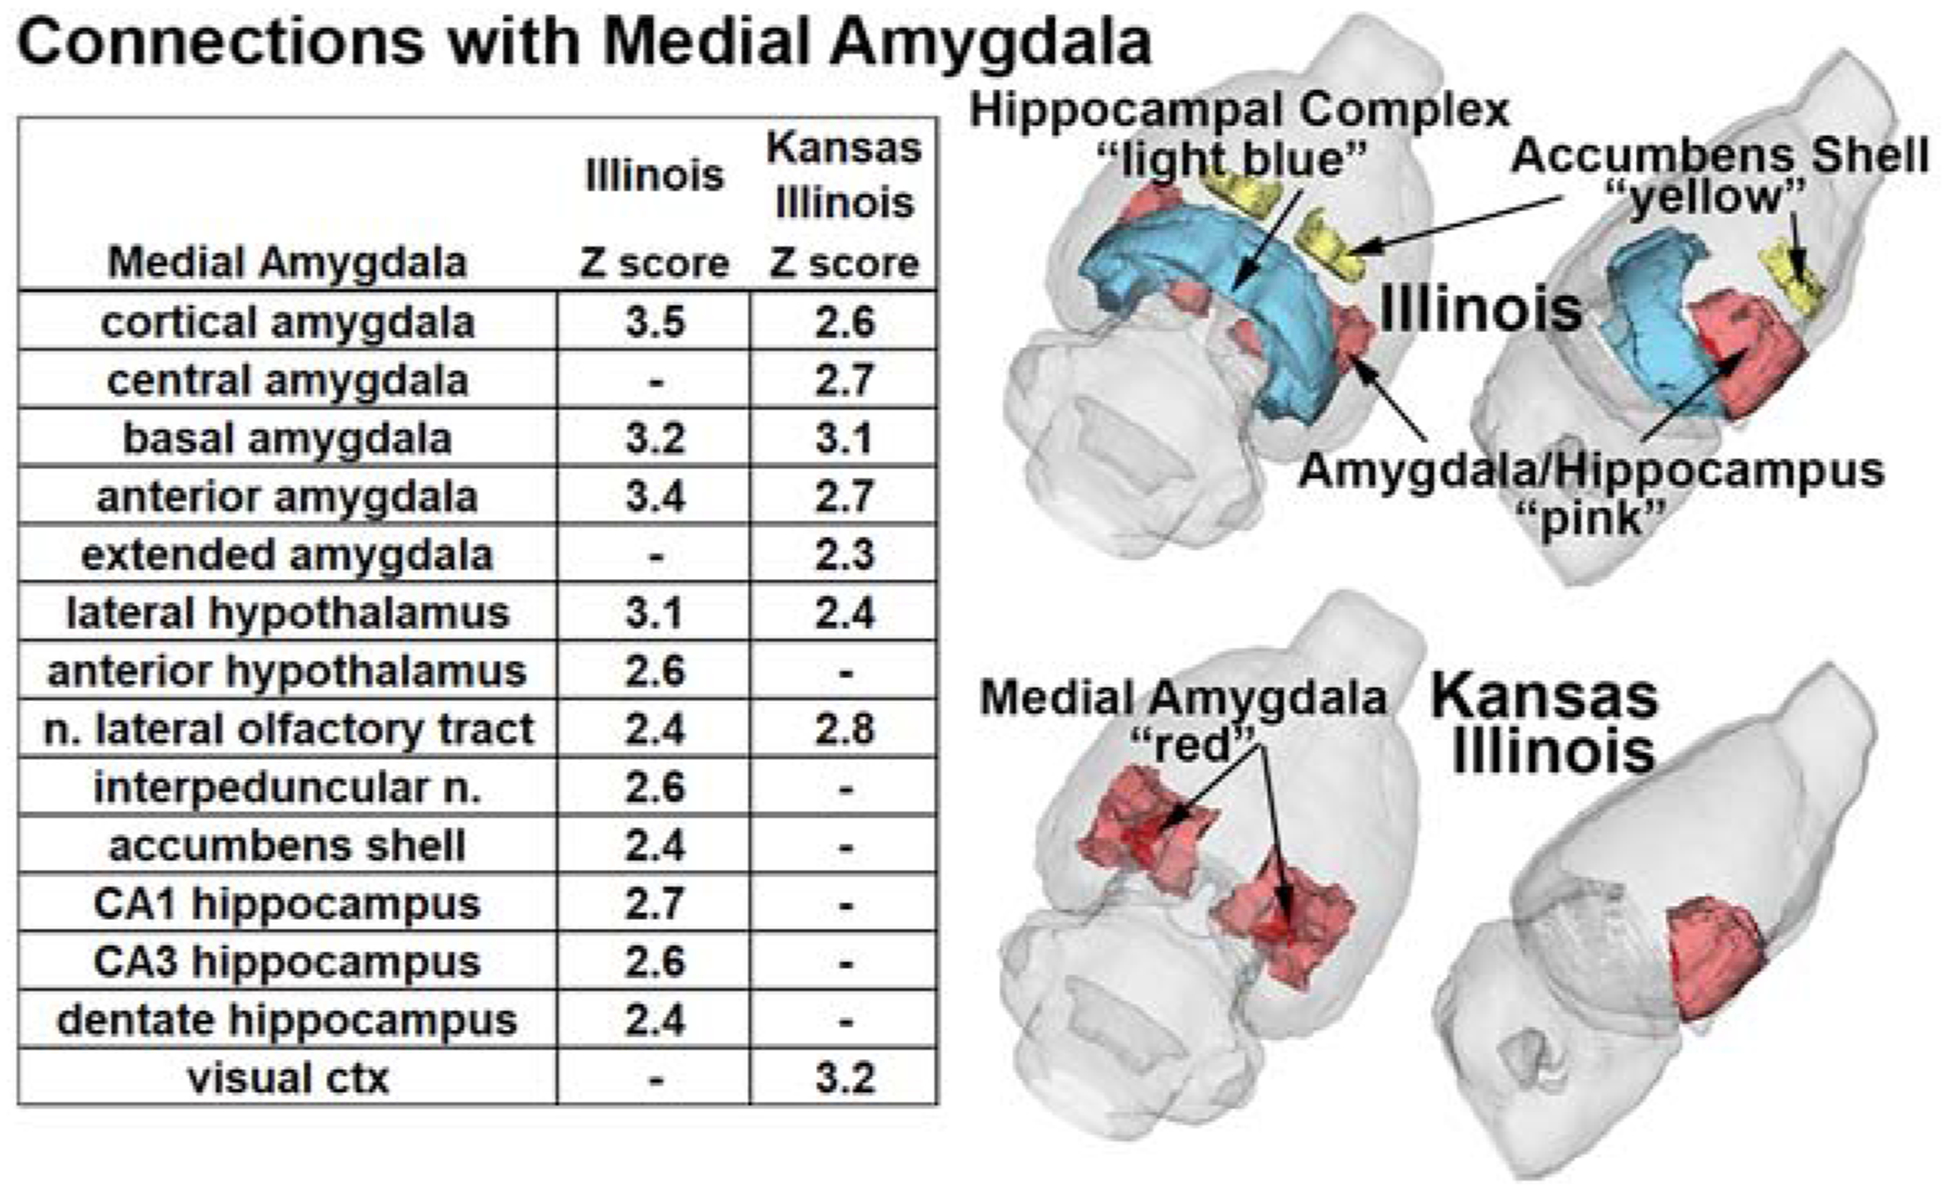
Figure 4.

Compares the significant functional connectivity with the MeA between IL and KI males. The colors in the 3D graphics indicate areas that show regions with higher functional connectivity in both populations. Embedded table show significant (|Z| > 2.3), while “–“ indicates ns) resting-state functional connections.
