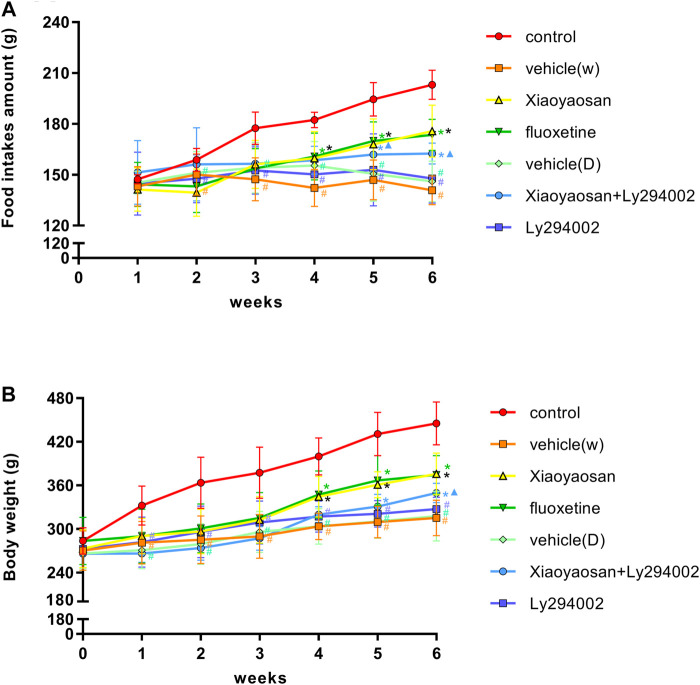
FIGURE 2.
Changes in the body weight and food intake of the CUMS rats. (A) Changes in food intake from week one1 to week 6. (B) Changes in body weight from week 0 to week 6. The data are expressed as the mean ± SD. #p < 0.05 compared to the control group; *p < 0.05 compared to the vehicle (W) group; ▲p < 0.05 compared to the Ly294002 group, n = =18.

