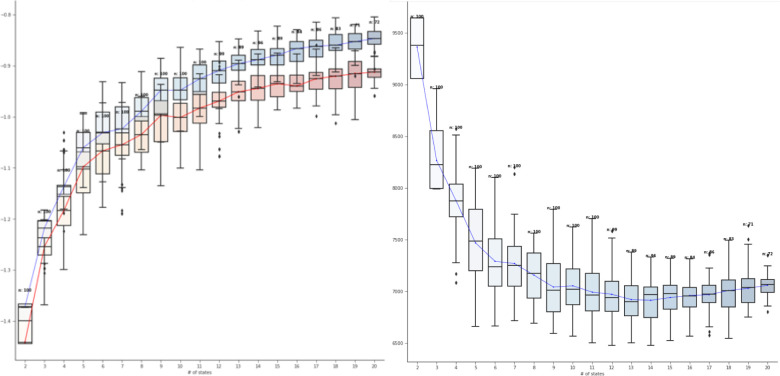
Figure 2:
Model performance (vertical axis) as a function of the number of latent states K (horizontal axis). The left view shows the model performance in terms of predictive likelihood score (LL) on the validation set; the right view shows the model performance in terms of Bayesian Information Criterion (BIC) on validation set.

