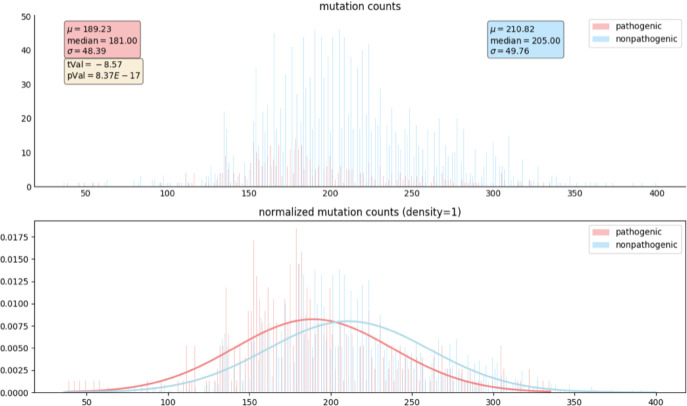
Figure 4.
Histogram and normalized histogram of the VNs of CAOS rules at pathogenic and non-pathogenic positions in BRCA1 BLAST sequences. The x-axis represents the variation number. The y-axis represents the number of gene positions (top) and the percentage of gene positions (bottom) with a specific variation number.

