Fig. 2.
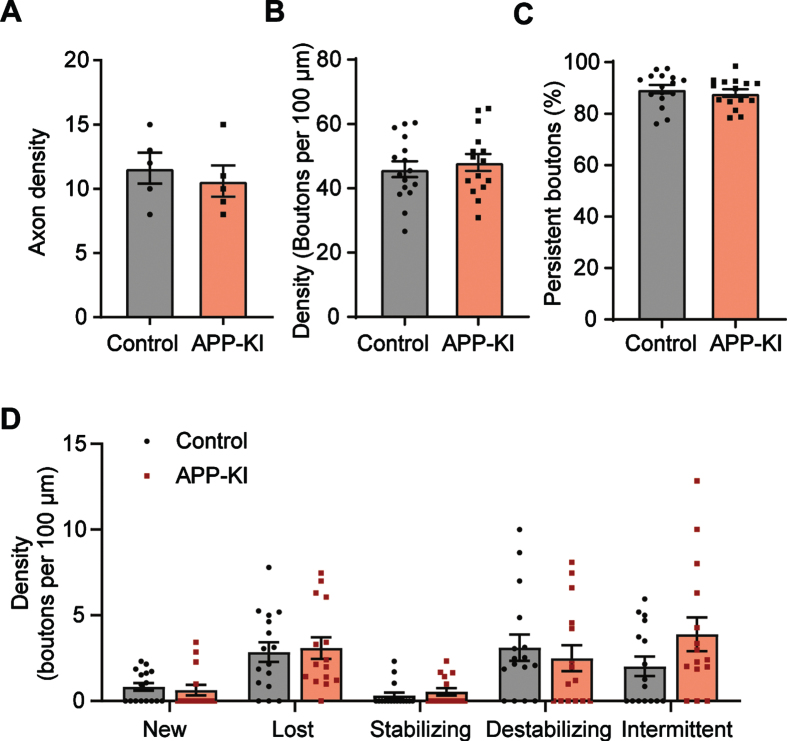
Inhibitory boutons dynamics in brain slices from young APP-KI mice are normal. A) Density of GFP-positive axons in the total imaging volume (t-test p = 0.57). B) Average bouton density per 100μm of axon (t-test p = 0.56). C) Percentage of persistent boutons (t-test p = 0.49). D) Density of the different non-persistent bouton subgroups (see methods) (2-way ANOVA with Sidak’s post-hoc, left to right, p = 0.99, 0.99, 0.99, 0.95, 0.12). Each data point in B-D represents one axon. Data from 4 independent experiments. Bars plotted are mean±SEM.

