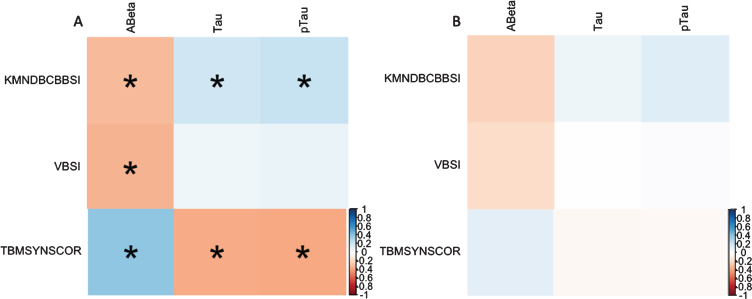
Fig. 1.
Correlation plot of atrophy measurements and CSF biomarkers. Correlation plot in Stable MCI (A) and reversion (B) groups. Aβ, amyloid-β; t-tau, total tau; p-tau, hyperphosphorylated tau; KMNDBCBBSI, K-means clustering differential bias-corrected BSI; VBSI, Ventricular BSI; TBMSYNSCOR, Tensor Based Morphometry –Symmetric Diffeomorphic Image Normalization score.*Significant correlation (p < 0.05).

