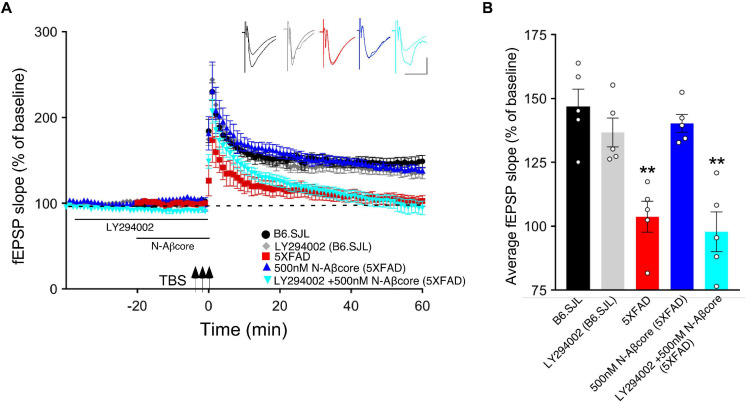
FIGURE 3.
N-Aβcore protection of Aβ-induced synaptic dysfunction involves the PI3 kinase pathway. (A) TBS-induced LTP for B6.SJL slices perfused with control aCSF (black) or 100 μM LY294002 (gray) and for 5xFAD slices with aCSF (red), 500 nM N-Aβcore (blue) or 500 nM N-Aβcore plus 100μM LY294002 (cyan). Color-coded inserts showing examples of fEPSPs (baseline vs. LTP). (B) Quantification of average fEPSP slope values for 50–60 min post-TBS (one-way ANOVA: F(4,20) = 13.63, p < 0.0001). Bonferroni post hoc tests showed that rescue of the LTP deficit in the 500 nM N-Aβcore-treated 5xFAD slices (**p = 0.004, 500 nM N-Aβcore 5xFAD vs. 5xFAD; p < 0.05, vs. aCSF B6.SJL) was blocked by 100 μM LY294002 pretreatment (**p = 0.0002, 100μM LY294002 + 500 nM N-Aβcore vs. aCSF B6.SJL). Arrows indicate timing of TBS in (A). All data are expressed as means ± SEM. N = 4 for each condition (1 slice/mouse). Inset calibration: horizontal, 10 ms; vertical, 0.4 mV. **p < 0.005.

