. 2021 Apr 20;10:e67740. doi: 10.7554/eLife.67740

Figure 2. Mice neonatally exposed to Pichia kudriavzevii demonstrate increased inflammatory responses during allergic airway disease later in life.

(a) Experimental procedure for neonatal exposure to P. kudriavzevii (Pichia; numbers indicate days of life) and (b) house dust mite (HDM) model of allergic airway disease (AAD). Dashed lines indicate the period of neonatal exposure in the pups. (c–i) Control and Pichia mice were born to dams treated with either PBS or yeast cells for 2 weeks after giving birth, respectively, and intranasally sensitized and challenged with HDM extract. (c) Lung pathology scores (left; 4–20) and representative images (right; 4× objective). (d) ELISA detection of serum IgE. (e) Representative eosinophil staining (left; pre-gated on single CD45+CD11 bhigh cells), frequency (middle), and total numbers of eosinophils (right) in the lung. (f) Frequencies (left) and numbers (right) of ICOS+ T cells (pre-gated on CD3+CD4+ cells) in the lung. (g) Frequencies (left) and numbers (right) of RORγthigh T cells (pre-gated on CD3+CD4+ cells) in the lung. (h) Frequencies (left) and numbers (right) of IL-17+T cells (pre-gated on CD3+CD4+ cells) in the lung. (i) Frequencies (left) and numbers (right) of GATA3+T cells (pre-gated on CD3+CD4+ cells) in the lung. Data in (c–h) are pooled from three independent experiments each showing the same trends (control n = 13, Pichia n = 17). Data in (i) are pooled from two independent experiments each showing the same trends (control n = 9, Pichia n = 13). Dots represent individual mice and lines indicate the group mean. *p<0.05, **p<0.01, ***p<0.001; unpaired two-tailed Student’s t-test with Welch’s correction.

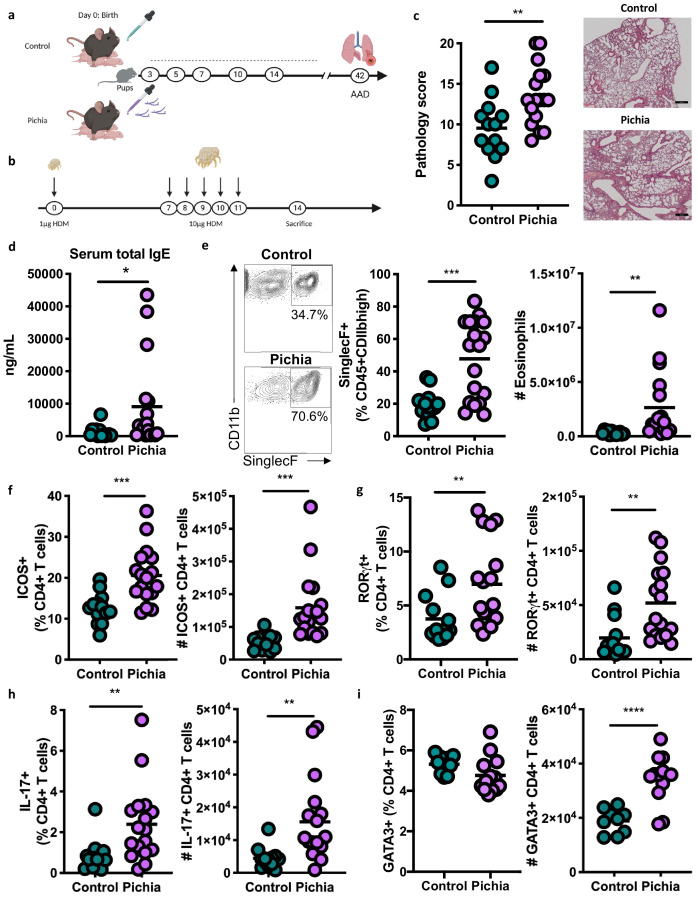
Figure 2—source data 1. Neonatal exposure lung cell counts.
Figure 2—source data 2. Neonatal exposure serum IgE.
Figure 2—source data 3. Neonatal exposure lung histology scoring.
Figure 2—source data 4. Neonatal exposure lung histology.
Figure 2—source data 5. Neonatal exposure lung pathology.

Figure 2.

Figure 2—figure supplement 1. Adolescent exposure to Pichia kudriavzevii does not alter inflammatory responses during allergic airway disease later in life.

Figure 2—figure supplement 1.

(a) Experimental procedure for adolescent exposure to P. kudriavzevii (Pichia; numbers indicate days of life) and house dust mite (HDM) model of allergic airway disease (AAD). (b–d) Control (n = 4) and Pichia (n = 5) mice were exposed to either PBS or yeast cells, respectively, via oral gavage for 2 weeks beginning at 4 weeks of age (day 28 of life) and intranasally sensitized and challenged with HDM extract according to the protocol in Figure 2b. Dashed lines indicate the period of fungal exposure. (b) Lung pathology scores (4–20). (c) Frequencies (left) of SinglecF+ cells (pre-gated on CD45+CDllbhigh single cells) and total numbers of eosinophils (right) in the lung. (d) Frequencies (left) of ICOS+ T cells (pre-gated on Lineage+CD3+CD4+ cells) in the lung. (e) Frequencies (left) of IL-17+T cells (pre-gated on CD3+CD4+ cells) in the lung. (f) Frequencies (left) of IL-4+T cells (pre-gated on CD3+CD4+ cells) in the lung. Dots represent individual mice and lines indicate the group mean. All results are not significant unless otherwise indicated. *p<0.05; unpaired two-tailed Student’s t-test with Welch’s correction.
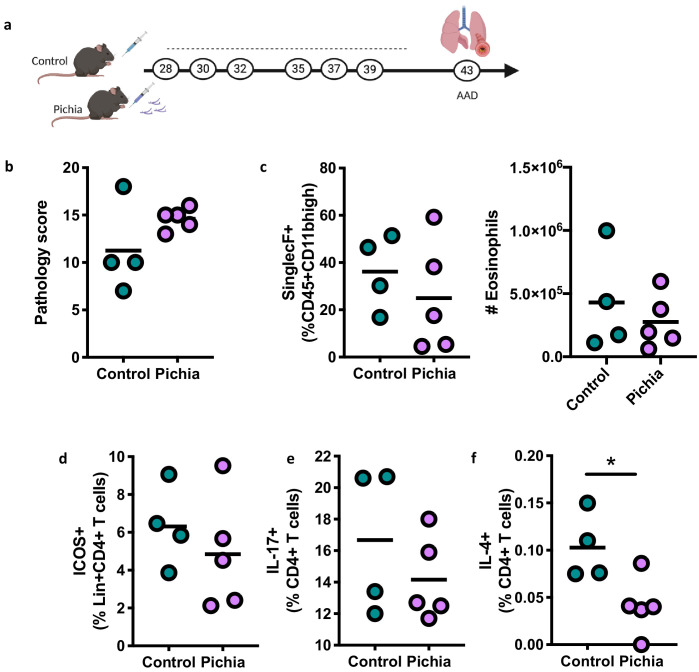
Figure 2—figure supplement 1—source data 1. Adolescent exposure lung cell counts.
Figure 2—figure supplement 1—source data 2. Adolescent exposure histology scoring.