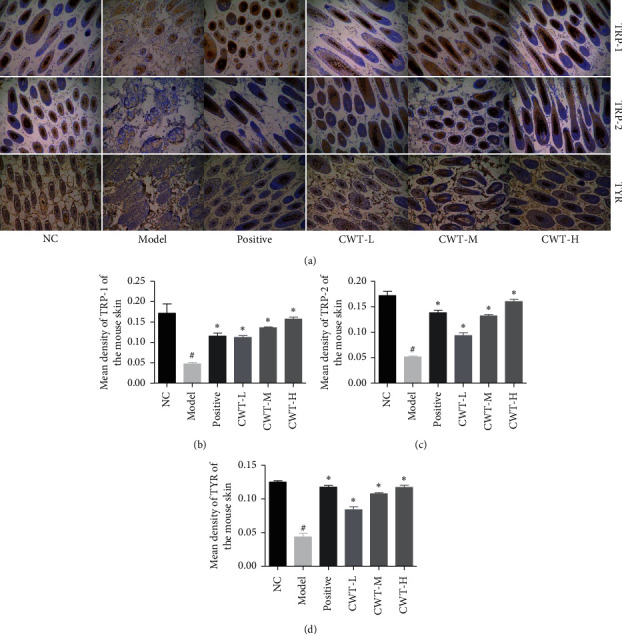
Figure 3.

Immunohistochemical staining of shaved mouse skin 200x. (a) Expression of TYR, TRP-1, and TRP-2. (b) Mean density of TRP-1. (c) Mean density of TRP-2. (d) Mean density of TYR. Values are expressed as the mean ± SD of five separate experiments. ##P < 0.05 vs. the normal control group. ∗∗P < 0.05 vs. the model group. NC, blank group; positive, positive control.
