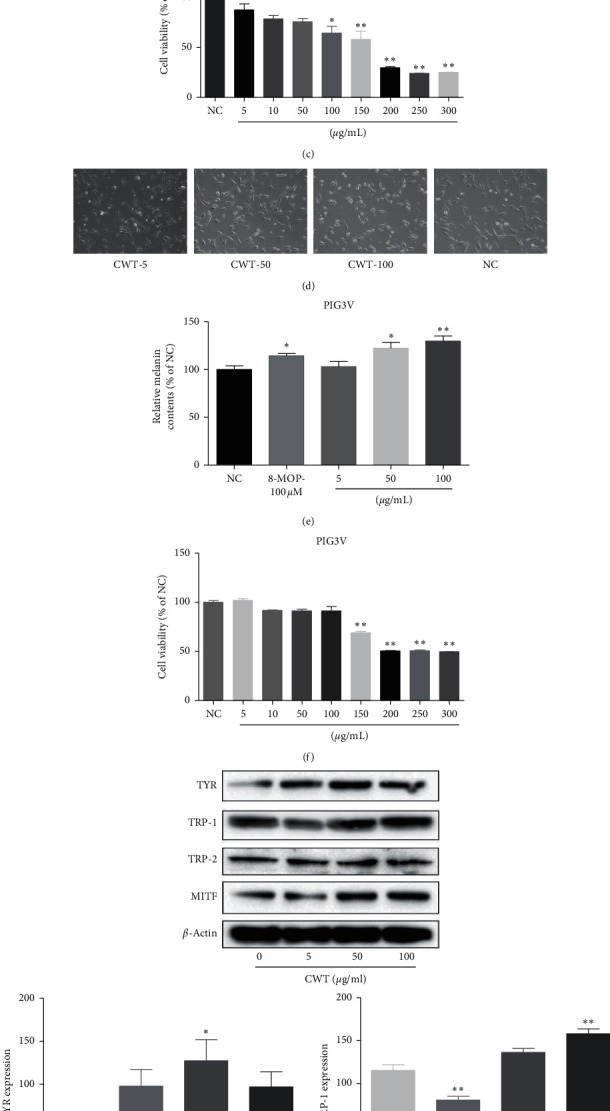
Figure 5.

(a) Cell morphology of B16 cells at magnification ×200. (b) Melanin content in B16 cells. (c) B16 cell viability measured by MTT assay. (d) Cell morphology of PIG3V cells at magnification ×200. (e) Melanin content in PIG3V cells. (f) PIG3V cell viability measured by MTT assay. (g) Western blot assays of TYR, TRP-1, TRP-2, and MITF expression levels. Values are expressed as the mean ± SD of three separate experiments. ∗∗P < 0.05 and ∗∗∗∗P < 0.01 compared with untreated cells.
