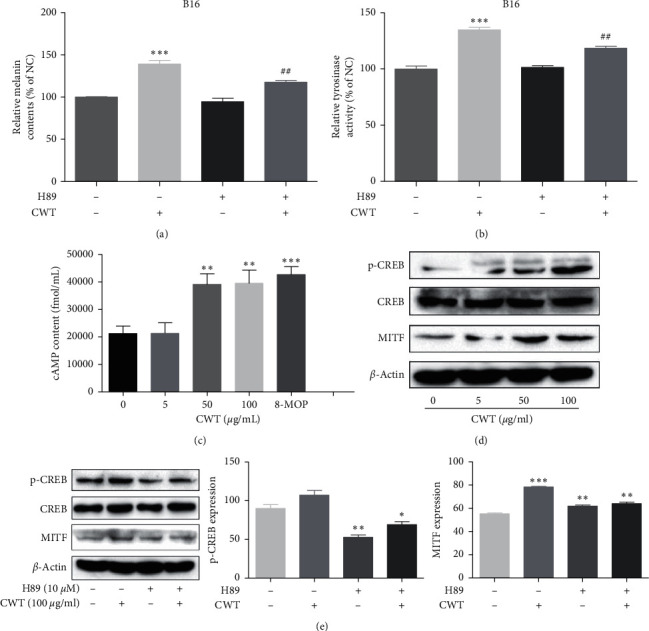
Figure 6.

Effects of CWT extract on the PKA signal pathway. (a) The measurement of melanin content. (b) Measurement of TYR activity. (c) cAMP content was measured by a cAMP-ELISA kit. (d) p-CREB, MITF, and CREB measured by Western blot analysis. (e) p-CREB CREB and MITF expression levels proincubated with the inhibitor measured by Western blot analysis. ∗∗∗∗P < 0.01 and ∗∗∗∗∗∗P < 0.001 vs. the untreated control group. ####P < 0.01 vs. the single treatment group.
