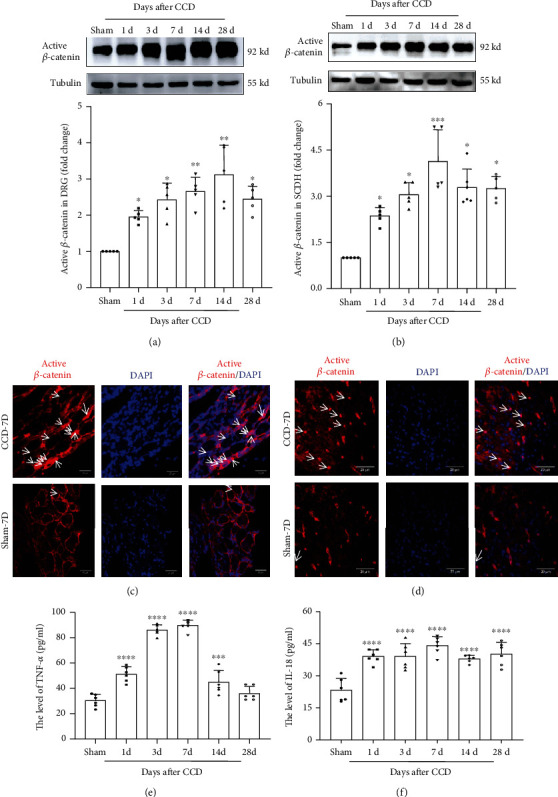
Figure 2.

Expression and nuclear translocation of active β-catenin protein in DRG and SCDH and the levels of TNF-α and IL-18 in serum after CCD. Western blot showing the expression of active β-catenin in (a) DRG and (b) SCDH at different time points. The expression of active β-catenin (red) and its transport of the superficial (c) DRG and (d) SCDH into the nucleus (DAPI). Arrows indicate some of the nuclear transport of active β-catenin. Tissues were collected on CCD day 7. The sections were imaged with a (c) fluorescence microscope and a (d) confocal microscope. Original magnification, scale bars: 20 μm. ELISA displaying the levels of (e) TNF-α and (f) IL-18 in rat serum at different time points after CCD (n = 6). Serum was collected on CCD day 7. Bars represent group means ± SD, n = 5. One-way ANOVA, ∗P < 0.05, ∗∗P < 0.01, ∗∗∗P < 0.001, and ∗∗∗∗P < 0.0001 versus sham.
