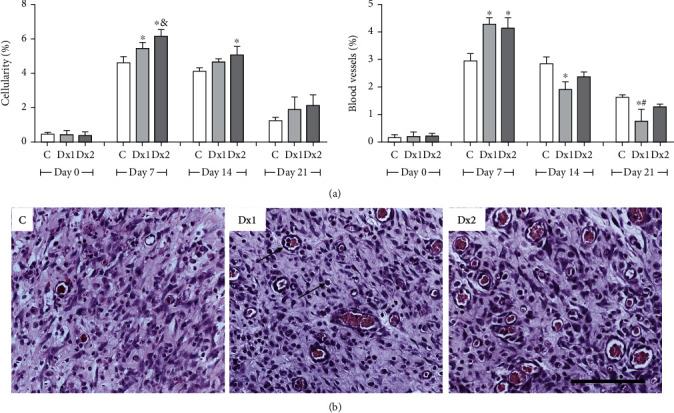
Figure 5.

The proportion of cell nucleus and blood vessels (a) and representative photomicrographs showing cells and blood vessel distribution (b) in the scar tissue of rats untreated and treated with doxycycline hyclate (Dx), on day 7 (H&E staining, bar = 100 μm). C: control, Dx1 = 10 mg/kg Dx, and Dx2 = 30 mg/kg Dx. In the graphics, the data are represented as mean and standard deviation. The statistical difference compared to the groups ∗C, &Dx1, and #Dx2 (Student-Newman-Keuls test, p < 0.05).
