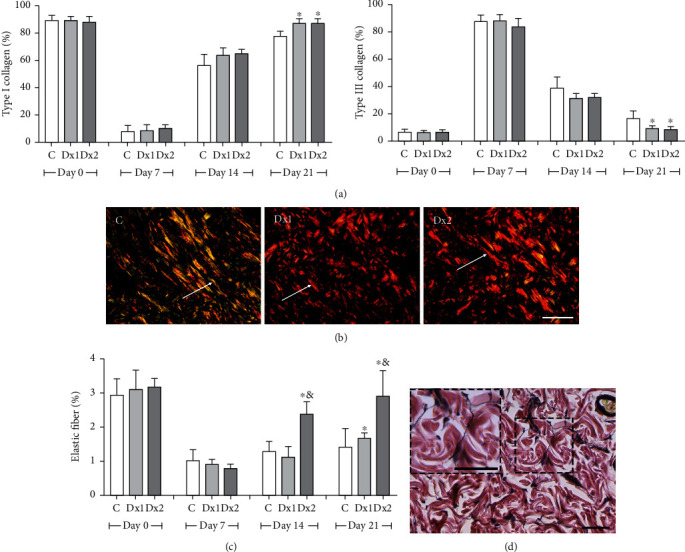
Figure 7.

The proportion of type I and III collagen fibers (a), representative photomicrographs showing collagen fiber distribution, on day 21 ((b) Sirius red staining under polarized light, bar = 100 μm), the proportion of elastic fibers (c), and representative photomicrograph showing elastic fiber distribution in group Dx2, on day 21 ((d) Verhoeff's elastic stain, bar = 50 μm) in the scar tissue of rats untreated and treated with doxycycline hyclate (Dx). C: control, Dx = 10 mg/kg Dx, and Dx2 = 30 mg/kg Dx. In the graphics, the data are represented as mean and standard deviation. The statistical difference compared to the groups ∗C and &Dx1 (Student-Newman-Keuls test, p < 0.05).
