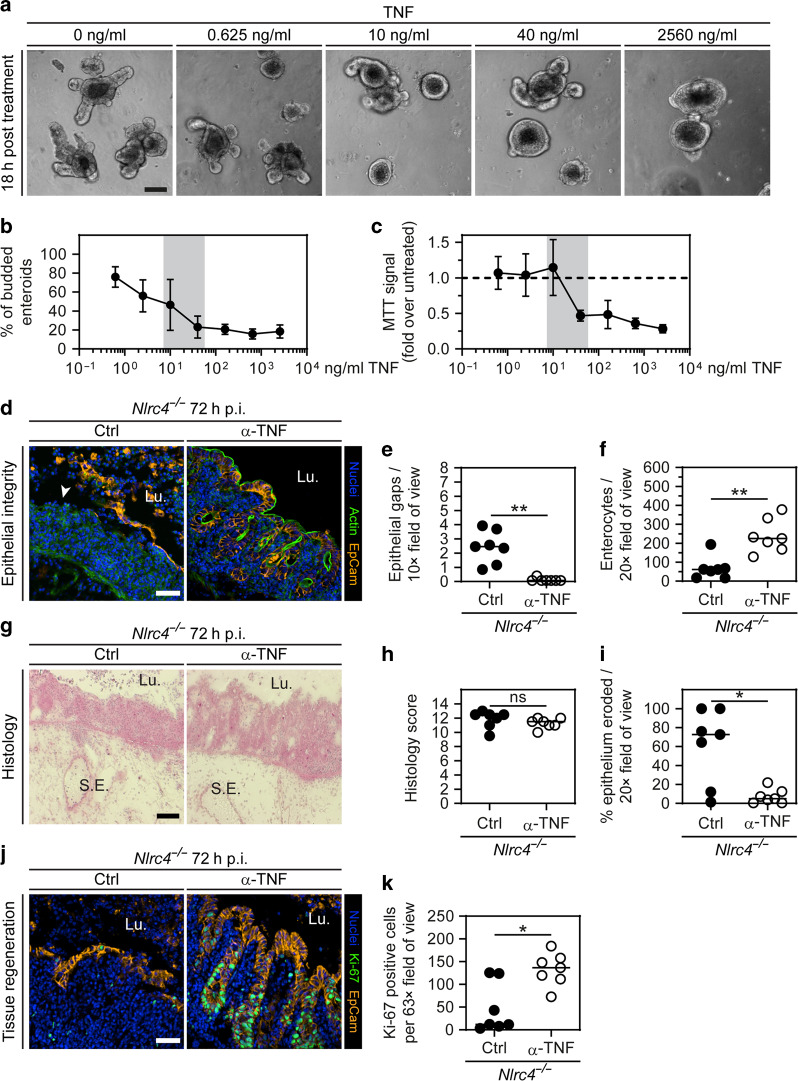
Fig. 6. TNF depletion preserves epithelial barrier integrity in NLRC4-deficient mice at 72 h p.i.
a–c Effect of TNF on enteroids. a, b Enteroids were exposed to TNF 3 days post seeding. a Representative micrographs of enteroids at 18 h of treatment with different concentrations of TNF. Scale bar: 100 µm. b Microscopy-based quantification of percentage budded enteroids. c Enteroids were exposed to TNF directly after seeding. MTT assay at 6 days post seeding. Fold change of light absorption at 562 nm over untreated is plotted. b, c Each data point represents the mean with SD of ≥4 separately treated cultures. Gray area represents the approximate range of TNF concentration measured in littermate controls and Nlrc4−/− mice (derived from the data in Fig. 5f). d–k 72 h S.Tm infection of Nlrc4−/− mice treated with isotype control or anti-TNF. d–i TNF depletion preserves epithelial integrity in NLRC4-deficient mice. d Representative micrographs of cecal tissue from littermate controls and Nlrc4−/− mice at 72 h p.i. White arrowhead indicates epithelial gap. Lu. lumen. Scale bar: 50 µm. e Microscopy-based quantification of epithelial gaps per 10× field of view. Detection limit at 0.07. f Microscopy-based quantification of enterocytes per 20× field of view. g Representative micrographs of cryo-embedded H&E-stained cecal tissue sections at 72 h p.i. Lu. lumen, S.E. submucosa edema. Scale bar: 100 µm. h Microscopy-based quantification of histology score. i Microscopy-based quantification of percentage epithelium eroded. H&E-stained tissue sections as in g were used for quantification. Detection limit at 0.6%. j, k TNF depletion preserves the epithelium proliferation capacity in infected NLRC4-deficient mice. j Representative micrographs of cecal tissue sections stained for cell proliferation marker Ki-67 at 72 h p.i. Lu. lumen. Scale bar: 50 µm. k Microscopy-based quantification of Ki-67 positive epithelial cells per 63× field of view. j, k Specific areas without epithelial gaps were chosen. e, f, h, i, k Each data point represents one mouse. Line at median. Seven mice per group from two independent experiments. Mann–Whitney U test (ns—not significant, *p < 0.05, **p < 0.01).

