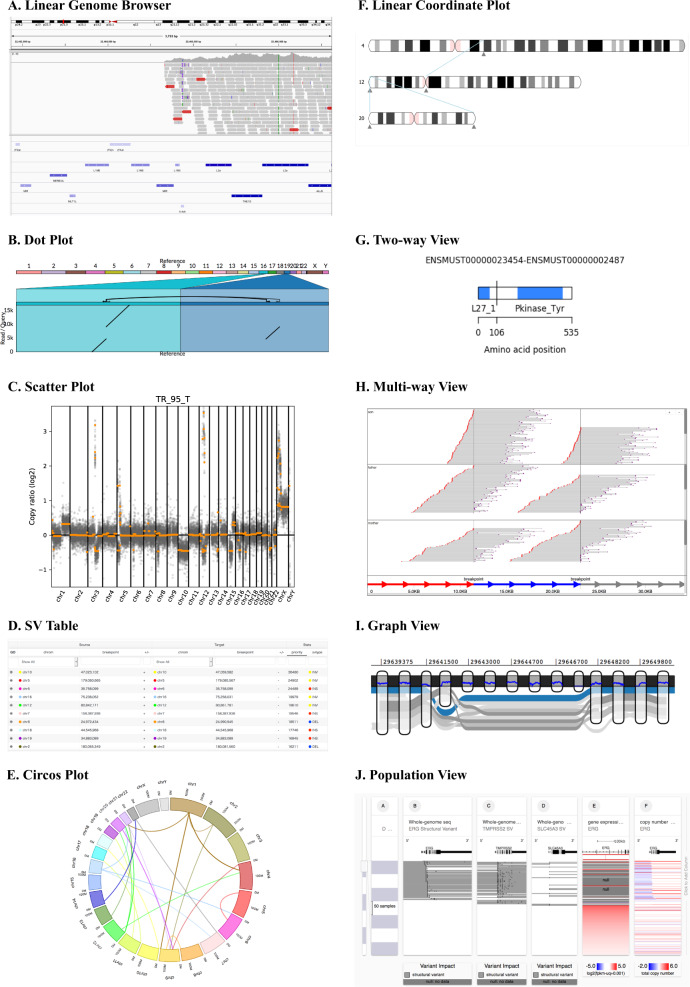
Fig. 1.
Screenshots of view modules. a Linear Genome Browser (here, IGV) shows Illumina read alignments and annotations for a cancer cell line, LC-2/ad: a large deletion in chromosome 9 with read alignments (in the middle) and repeat annotations (in the bottom) is shown. Alignments courtesy of Mr. Sarun Sereewattanawoot and Prof. Yutaka Suzuki. b Dot plot implemented in Ribbon shows the split-read alignment between a long PacBio read and the two regions on the human genome: a breast cancer cell line, SK-BR-3, exhibits a translocation between chromosome 16 and 19. c. Scatter plot in CNVKit shows the distribution of copy number alterations identified by Illumina reads: a semi-log scatter plot shows the normal-tumor copy ratio across all chromosomes in a melanoma sample. d SV table in MoMI-G for filtering and navigation: a list of SVs identified in CHM1, a hydatidiform mole genome. e Circos plot shows inter-chromosomal SVs identified by using 10x Chromium: SVs between the human reference genome and the NA12878 sample. f Linear Coordinate plot shows SVs between the NA12878 sample and the human reference genome: SVs between chromosome 4, 12, and 20 are shown. g Two-way view in AGFusion shows two fusion partner genes with details on each side: a fusion gene across DLG1 and BRAF (535 amino acids in total) in the mouse genome. h Multi-way view in svviz shows Illumina read alignments along three genomic intervals: the two breakpoints are suggested by the paired-end mapping of the Illumina reads from a trio sample (HG002/003/004). i Graph view in MoMI-G (implemented by using SequenceTubeMap) shows a graphical view of a genomic region with long-read alignments: a deletion of >200 bp is identified by the read alignments. j Population view in UCSC Xena shows SV calls, gene expression, and the copy numbers of multiple genomes: copy numbers on ERG across more than 300 samples represented as a heatmap

