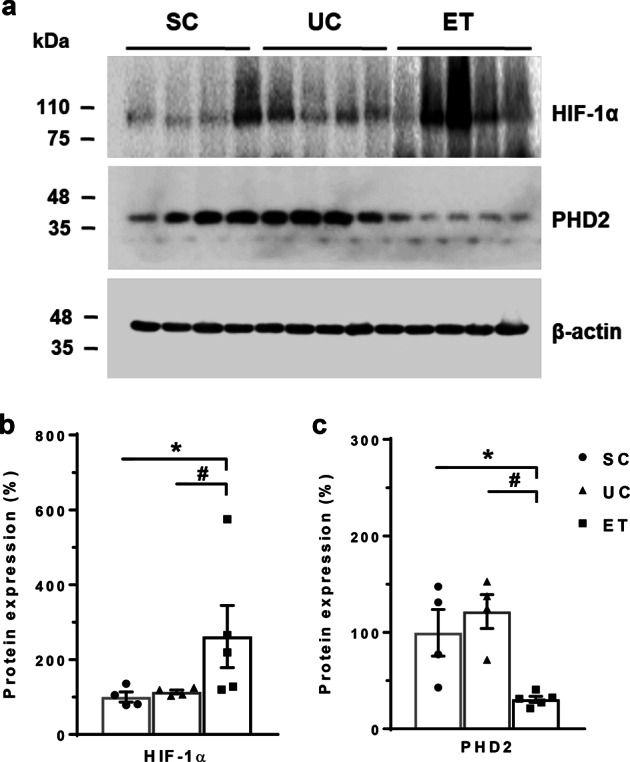
Fig. 2.

Immunoblot analysis of HIF-1α and HIF PHD2 in the renal medulla. Immunoblots with antibodies to HIF-1α and PHD2 are shown in the renal medulla (a). Each lane was loaded with a protein sample from a different rat. Densitometric analyses revealed a significant increase in HIF-1α (b) and a decrease in PHD2 (c) expression in the ETs versus the UCs. Anti-β-actin protein was used as a loading control. SCs, sham controls (n = 4); UCs, uninephrectomized controls (n = 4); ETs, empagliflozin-treated rats (n = 5). *P < 0.05 vs. SCs; #P < 0.05 vs. UCs by the Mann–Whitney U test
