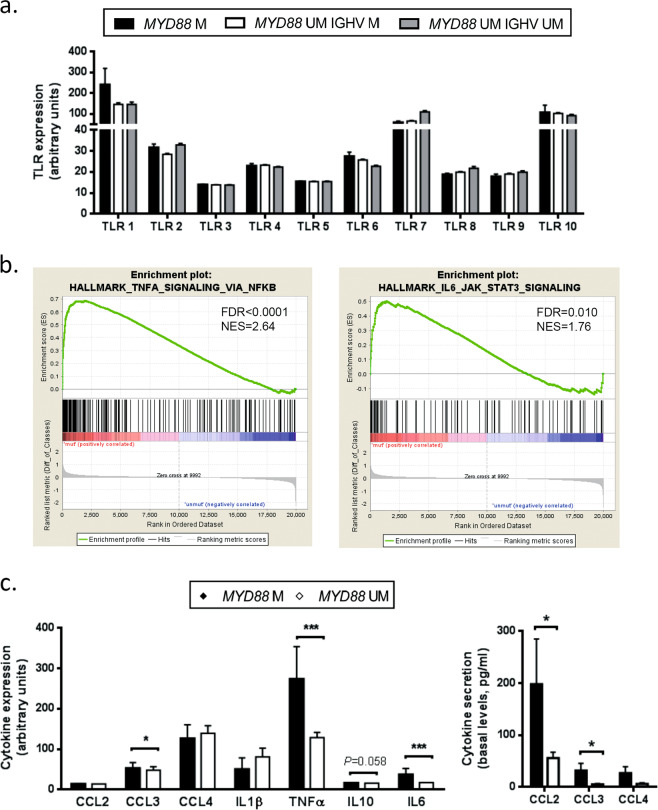
Fig. 1.
MYD88-mutated CLL cases harbor an inflammatory phenotype. a TLR gene expression profile in CLL cells comparing MYD88-mutated (n = 18 IGHV-mutated) and MYD88-unmutated cases (n = 249 IGHV-mutated and n = 143 IGHV-unmutated). b Gene set enrichment analysis comparing MYD88-mutated (n = 18) versus MYD88-unmutated (n = 249) CLL cases (all IGHV-mutated). c Left panel: Cytokine transcript levels of MYD88-mutated (n = 18) and MYD88-unmutated CLL cases (n = 249 IGHV-mutated CLL samples) analyzed by gene expression profile. Right panel: Cytokine secretion of CLL cells from MYD88-mutated (n = 6) and MYD88-unmutated (n = 9) cases (all IGHV-mutated) was analyzed after 48 h of culture by flow cytometry using Luminex® Bead Panel. Bars represent the mean ± SEM of all samples analyzed. Wilcoxon signed-rank test was used for statistical analysis. *P < 0.05, ***P < 0.001. Gene sets with false discovery rate (FDR) q value < 0.05 and a normalized enrichment score (NES) ≥ 1.5 were considered to be significantly enriched in the mutated group. M mutated, UM unmutated

