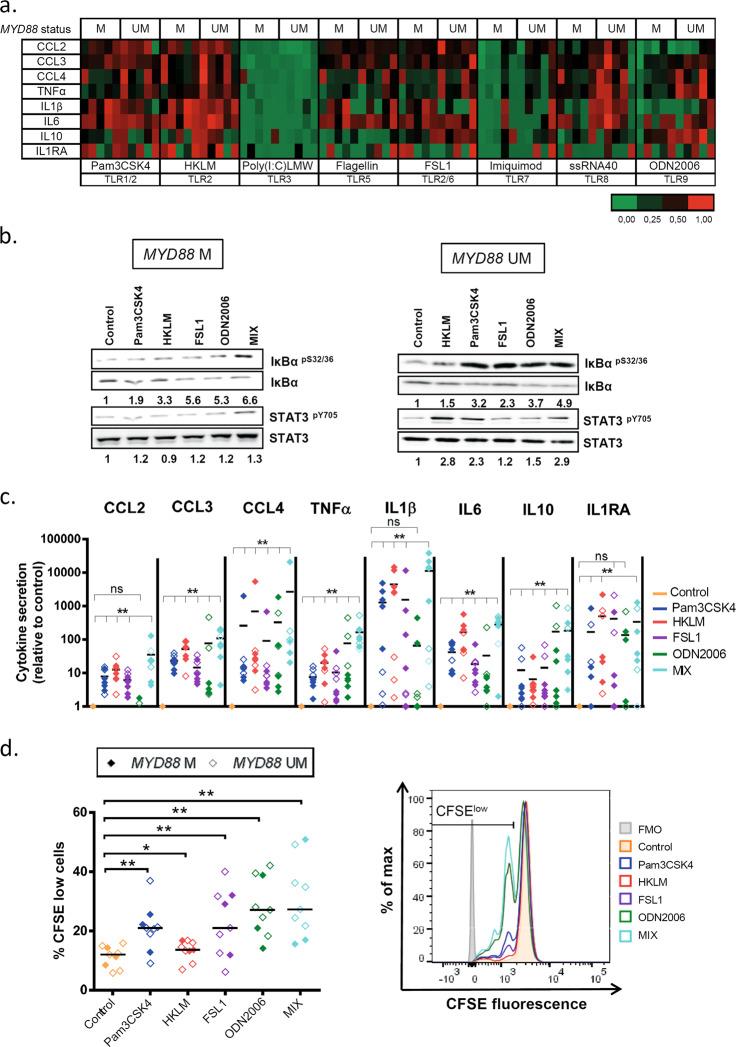
Fig. 2.
TLR stimulation increases cytokine secretion, NF-κB and STAT3 signaling and proliferation of CLL cells. CLL cells were cultured with single TLR agonists or the TLR agonist mix (Pam3CSK4, HKLM, FSL1 and ODN2006). a Heatmap representing cytokine secretion in CLL supernatants after 48 h of TLR stimulation of MYD88-mutated and MYD88-unmutated cases (n = 5 each) analyzed by flow cytometry Luminex® Bead Panel. The level of secretion of each cytokine is represented relative to each control. b Western blot analysis of IκBαpS32/36 and STAT3pY705 phosphorylation and total levels of IκBα and STAT3 in CLL cell extracts after 3 h of single or TLR agonist mix stimulation. Analysis of α-tubulin was used as loading control. A representative MYD88-mutated (#07) and MYD88-unmutated (#25) CLL case are shown. Ratios of phosphorylated and total protein levels were calculated and provided numbers are as fold changes relative to the untreated control sample. c Cytokine secretion after 48 h of TLR stimulation was assessed in cell culture supernatants of MYD88-unmutated (n = 3) and MYD88-mutated (n = 5) CLL cases by flow cytometry Luminex® Bead Panel. Data are presented as fold change relative to unstimulated control. Wilcoxon signed-rank test was used for statistical analysis. d Left panel: Percentage of proliferating CD19+ CLL cells after single or TLR agonist mix stimulation for 6 days measured by CFSE dilution (n = 3 MYD88-mutated; n = 6 MYD88-unmutated). Right panel: Flow cytometry histogram of a representative MYD88-unmutated CLL case (#51) shows proliferating cells (gated on viable CD19+ cells) after 6 days of TLR and IL15 stimulation. A decrease in CFSE signal is indicative for cells that have divided. Wilcoxon matched-paired signed-rank test was used for statistical analysis. Horizontal bars represent population means. n.s. not significant, P ≥ 0.05, *P < 0.05, **P < 0.01. M mutated, UM unmutated, FMO fluorescence-minus-one

