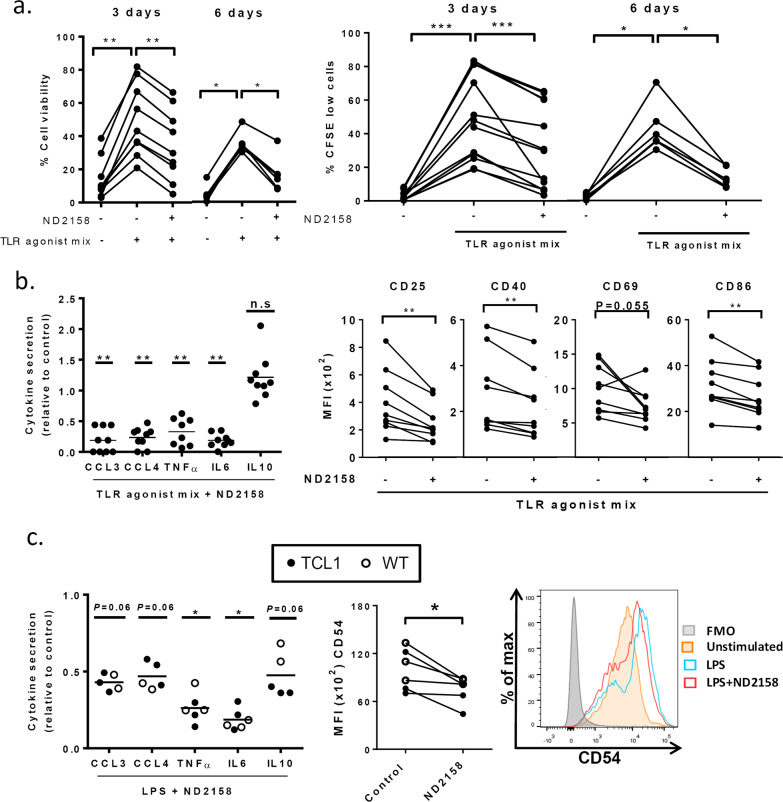
Fig. 5.
Impact of ND2158 on Eµ-TCL1 CLL cells and monocytes from mice. Cells were stimulated with TLR agonist mix (B cells) or LPS (monocytes) for 30 min before 10 µM ND2158 treatment. a Left panel: Total splenocytes of 1-year-old leukemic TCL1 mice were treated as described above, and viability of CD19+CD5+ CLL cells was analyzed after 3 days (n = 9) and 6 days (n = 6) by flow cytometry using fixable viability dye. Right panel: Percentage of proliferating CD19+CD5+ CLL cells was measured by CFSE dilution after 3 and 6 days (n = 6). b MACS-sorted B cells from spleens of 1-year-old leukemic TCL1 mice (n = 9) were cultured for 6 h. Left panel: Cytokine secretion data acquired as above are shown relative to untreated control. Cytokine secretion was analyzed by flow cytometry using Luminex® Bead Panel. Right panel: CD25, CD40, CD69 and CD86 expression on CD19+CD5+ CLL cells was analyzed by flow cytometry. c MACS-sorted monocytes from 1-year-old wild-type (WT; n = 3) and TCL1 mice (n = 3) were cultured for 6 h. Left panel: Cytokine secretion data acquired as above are shown relative to untreated control. Asterisks indicate statistical significance level relative to control. Horizontal bars represent population means. Right panel: Median fluorescence intensity (MFI) of CD54 on murine monocytes was analyzed. Wilcoxon matched-pairs signed-rank test was used for statistical analysis. n.s. not significant; P ≥ 0.05, *P < 0.05, **P < 0.01, ***P < 0.001

