Fig. 7.
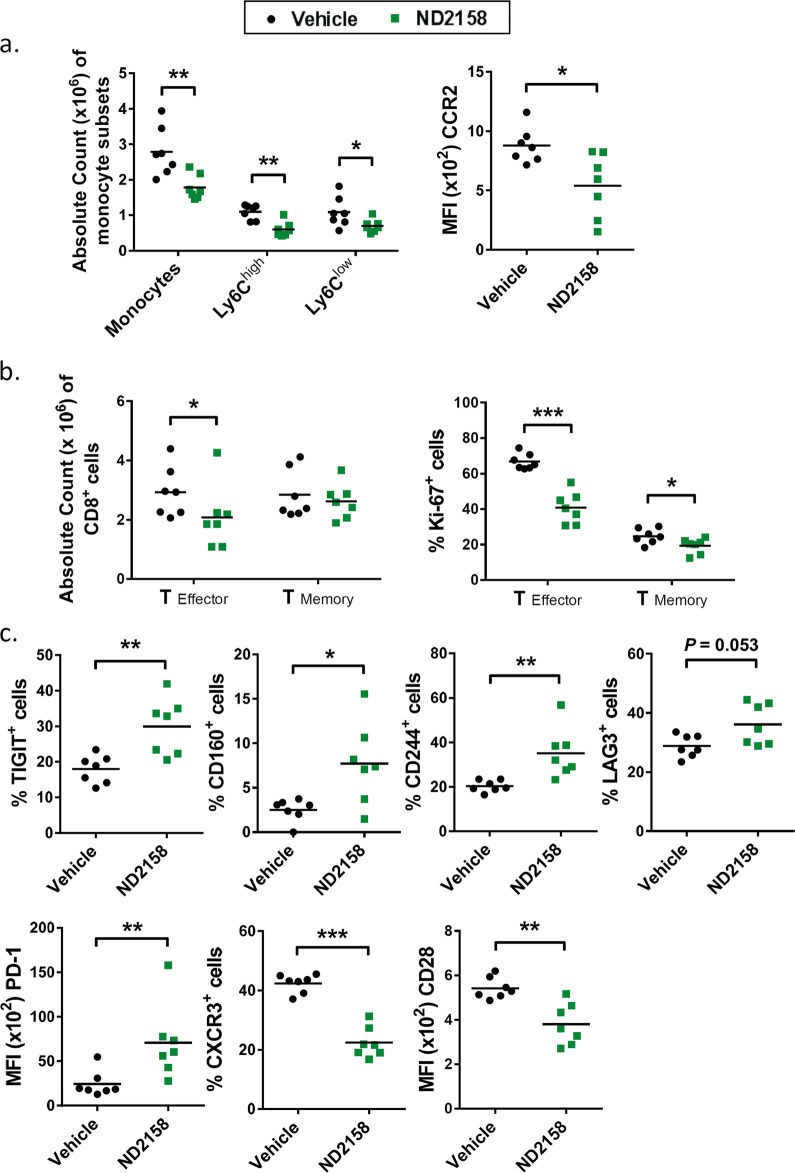
ND2158 impacts on the tumor microenvironment in the TCL1 adoptive transfer model. a Left panel: Absolute counts of monocytes in the spleen (SP) of vehicle- (n = 7) and ND2158-treated (n = 7) mice. Right panel: CCR2 protein expression (MFI) on Ly6C+ monocytes in the spleen acquired by flow cytometry. b Left panel: Absolute numbers of CD8+ effector and memory T cells in the spleen acquired by flow cytometry. Right panel: Percentage of Ki-67+CD8+ effector and memory T cells in the spleen of vehicle- and ND2158-treated mice analyzed by flow cytometry. c Protein expression analysis of inhibitory receptors and activation markers on CD8+ effector T cells by flow cytometry. Data are shown as percentage of TIGIT+, CD160+, CD244+, LAG3+, and CXCR3+ CD8+ effector T cells for bimodal populations or as MFI of costimulatory receptor CD28 as unimodal population. MFI of PD-1 was analyzed for PD-1+CD8+ effector T cells. Horizontal bars represent population means. Mann−Whitney test was used for statistical analysis. *P < 0.05, **P < 0.01, ***P < 0.001. MFI median fluorescence intensity, FMO fluorescence-minus-one

