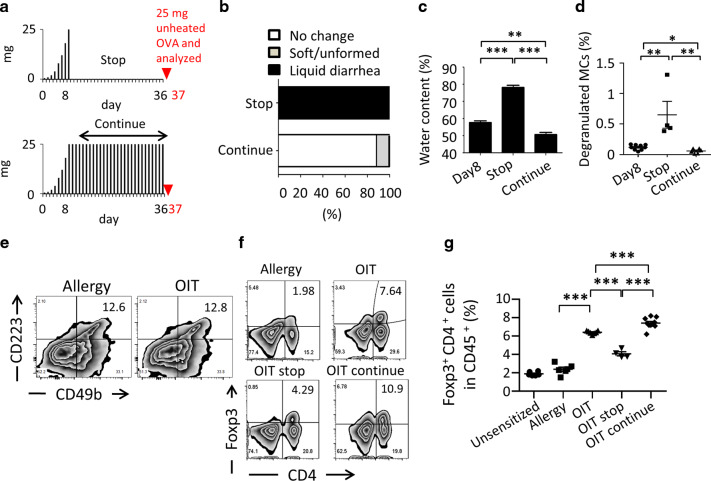
Fig. 2. Continuous exposure to allergen after successful oral immunotherapy (OIT) sustains the reduction in diarrhea and the regulatory T-cell response.
a The protocol used in this experiment. Black bars indicate the amounts (mg) of heated ovalbumin (OVA), and the red triangle indicates the oral administration of 25 mg unheated OVA. b Status of mice stools upon unheated OVA administration was evaluated. (Stop OIT, n = 4; continue OIT, n = 8). c Water content of stools was measured (OIT [day 8], n = 4; stop [day 37], n = 4; continue: n = 4 [day 37]). Data are shown as means ± SEM, **P < 0.01, ***P < 0.001. d CD63+ intestinal mast cells as a percentage of all CD45+ cells are shown (day 8 of OIT, n = 9; day 37 of stop, n = 4; continue, n = 4). e Cells were harvested from the colon and stained to evaluate the presence of Tr1 cells. Cells were gated on CD4. Number indicates percentage of CD223+ CD49b+ Tr1 cells. Data are representative of at least three individuals. f and g Cells were gated on CD45 and percentages of Foxp3+ CD4+ T cells are shown. Representative FACS plots were shown and each dot represents an individual mouse. Data are shown as means ± SEM, ***P < 0.001.

