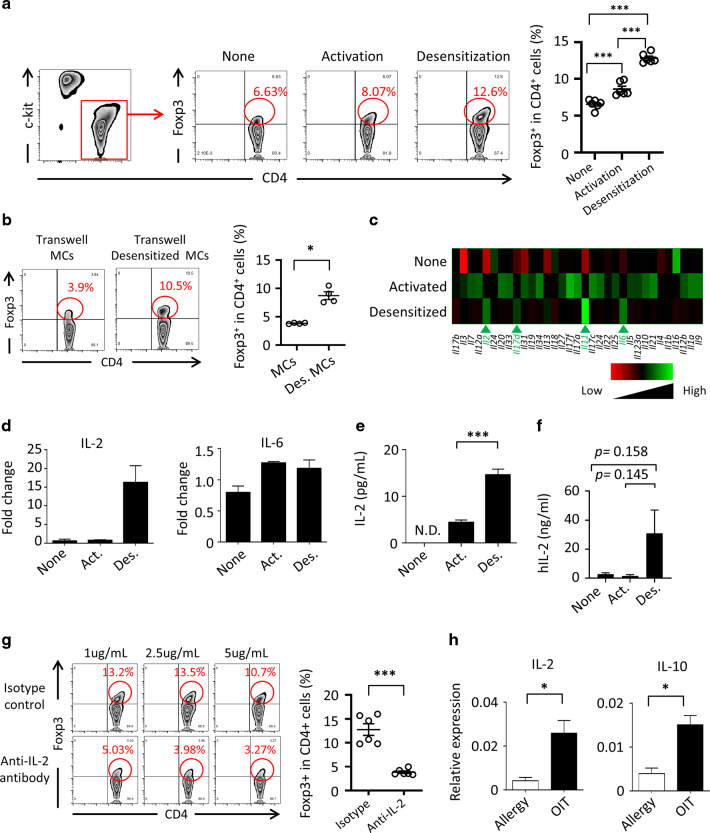
Fig. 6. Foxp3 Treg expansion by desensitized regulatory mast cells.
a DNP-IgE bound (None), antigen-stimulated (Activation), or desensitized (Desensitization) bone marrow MCs (BMMCs) were co-cultured with CD4+ T cells and expansion of the Foxp3+ CD4+ T cell population was analyzed by flow cytometry and cell sorting. Numbers indicate percentages of Foxp3+ among all CD4+ T cells. b IgE-bound and desensitized BMMCs and CD4+ T cells were co-cultured under separated conditions in transwells. Percentages of Foxp3+ cells among all CD4+ T cells are shown. c Gene microarray was performed with DNP-IgE bound (None), antigen-stimulated (Activated), and desensitized BMMCs. Shown is a heatmap representative of entities termed cytokines. d Expression of the genes encoding IL-2 and IL-6 was analyzed by quantitative RT-PCR. Data are shown as means ± SEM. Act., activated; Des., desensitized. e IL-2 production was analyzed by ELISA. Data are shown as means ± SEM. ***P < 0.001 (all groups, n = 5). f IL-2 production from hPBMC was analyzed by ELISA. Data are shown as means ± SEM; all groups, n = 3. g Percentages of Foxp3+ cells in coculture of desensitized BMMCs are shown. Isotype or anti-IL-2 antibody was added. h Gene expression of in vivo sorted MCs was analyzed by quantitative RT-PCR. Each result was normalized against the expression of Gapdh. Data are shown as means ± SEM, ***P < 0.01, *P < 0.05.

