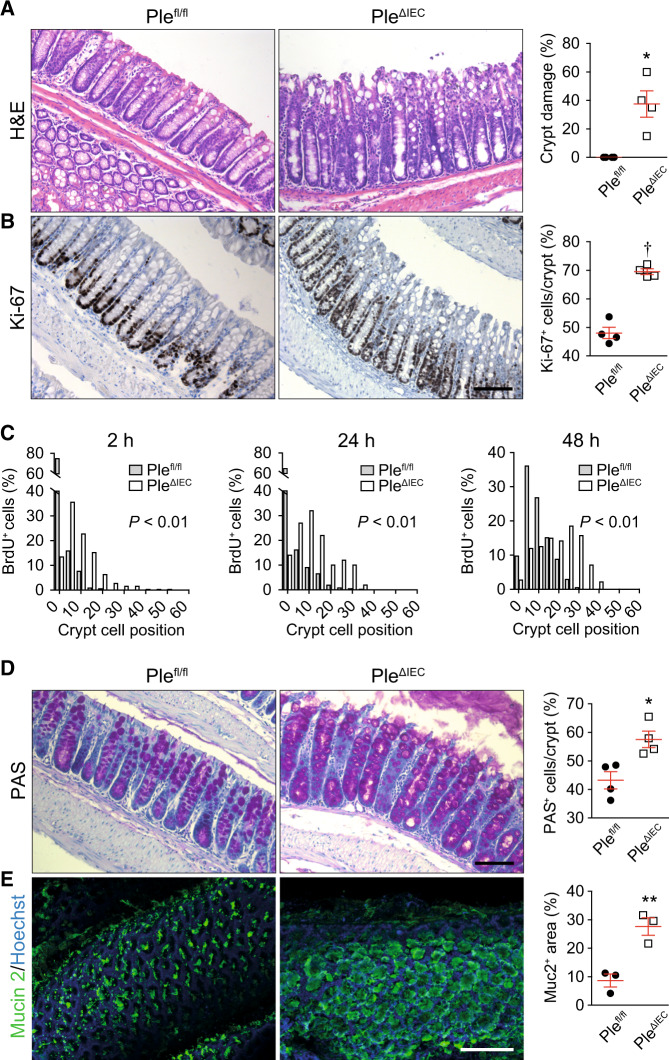
Fig. 2. Plectin-deficient IECs exhibit aberrant proliferation and differentiation, resulting in altered crypt organization.
A, B Representative images of H&E staining (A) and Ki-67 immunohistochemistry (proliferating cells) (B) of Plefl/fl and PleΔIEC paraffin-embedded colon sections. Scale bar, 100 μm. Graphs show quantification of colonic crypt damage given as a percentage of crypts with >5% of IECs detached from BM (A) and percentage of the Ki-67-positive (Ki-67+) IECs per crypt (B), n = 3–4. C Histograms showing the percentage of BrdU-positive (BrdU+) cells in given positions of Plefl/fl and PleΔIEC colonic crypts at 2, 24, and 48 h after BrdU pulse. Cells were numbered sequentially from crypt base to lumen, with cell position 0 assigned to the first cell at the base of each crypt. At least nine crypts per mouse were analyzed from three mice per time point and genotype. D, E Representative images of PAS staining (goblet cells) (D) and mucin-2 (Muc2) immunofluorescence in mucus layer (E) of Plefl/fl and PleΔIEC distal colon sections (D) and colon whole mounts (E). Scale bars, 100 μm (D), and 200 μm (E). Graphs show quantification of percentage of PAS-positive (PAS+) IECs per crypt (D) and percentage of mucin-2-positive (Muc2+) area per whole mount area examined (E), n = 3–4. Data are presented as mean ± SEM, *P < 0.05, **P < 0.01, †P < 0.001.

