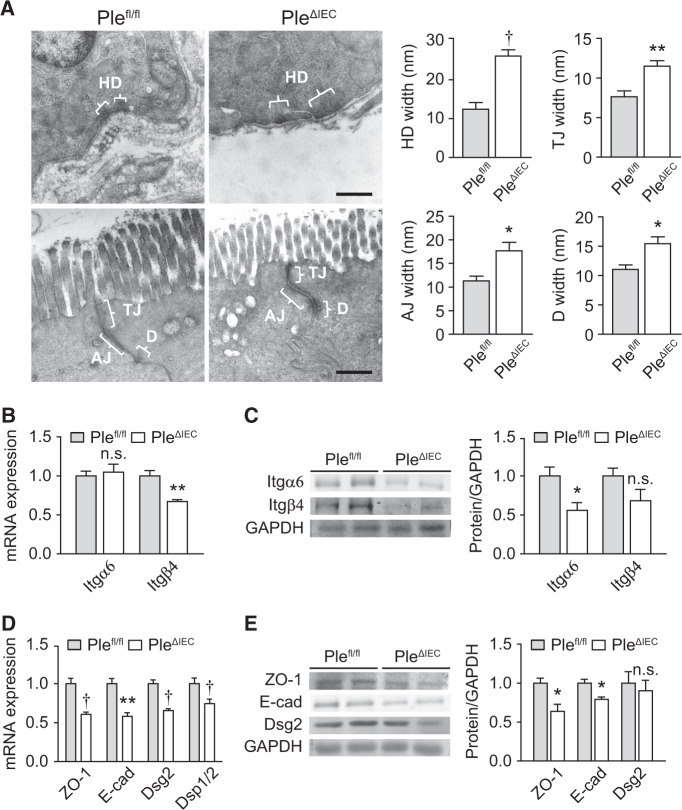
Fig. 3. Formation of aberrant cell junctions in PleΔIEC IECs.
A Representative TEM micrographs of Plefl/fl and PleΔIEC IEC junctional complexes. Braces (white) indicate hemidesmosomes (HD), tight junctions (TJ), adherens junctions (AJ), and desmosomes (Ds). Scale bar, 500 nm. Graphs show quantitative analyses of junctional complex widths (measured as the distance from IEC to BM (HD) or distance from IEC to IEC membrane (TJ, AJ, and Ds)). Five to fifteen junctions were measured (two mice per genotype). B Relative mRNA levels of integrin (Itg) α6 and β4 in scraped mucosa from Plefl/fl and PleΔIEC distal colons, n = 4–5. C Quantification of Itgβ4 and Itgα6 in scraped distal colon mucosa from Plefl/fl and PleΔIEC mice by immunoblotting. GAPDH, loading control. The graph shows relative band intensities normalized to average Plefl/fl values, n = 3. D Relative mRNA levels of ZO-1, E-cadherin (E-cad), desmoglein 2 (Dsg2), and desmoplakin 1/2 (Dsp1/2) in Plefl/fl and PleΔIEC distal colons, n = 5. E Quantification of ZO-1, E-cad, and Dsg2 in Plefl/fl and PleΔIEC colon mucosa by immunoblotting. GAPDH, loading control. The graph shows relative band intensities normalized to average Plefl/fl values, n = 3. Data are presented as mean ± SEM, n.s. not significant, *P < 0.05, **P < 0.01, †P < 0.001.

