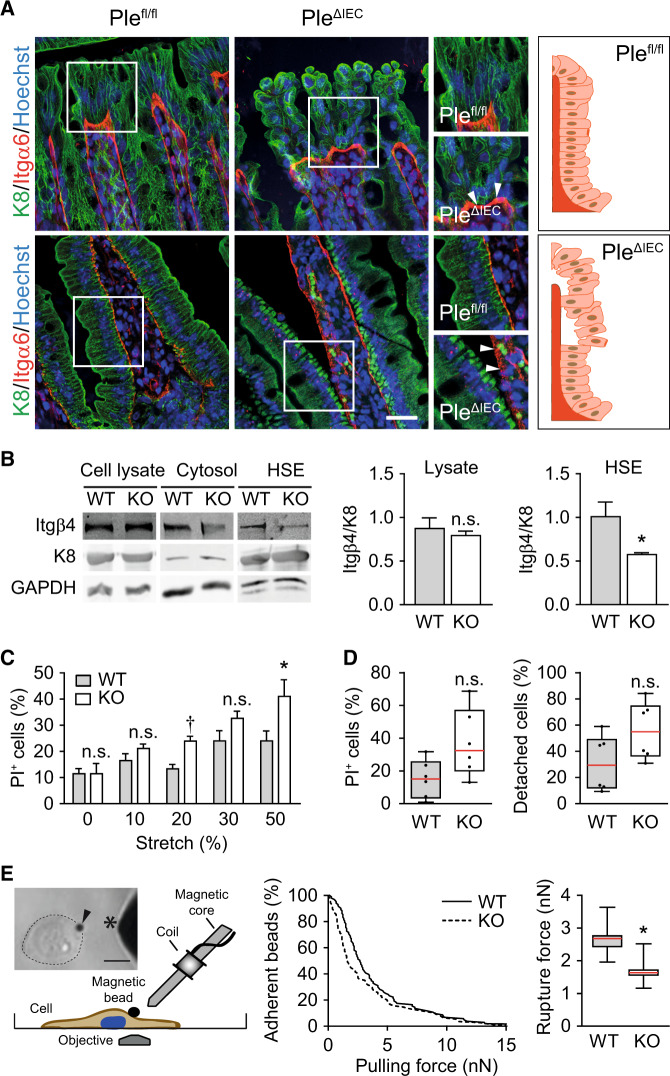
Fig. 5. Plectin stabilizes IEC hemidesmosomes through KF recruitment.
A Representative immunofluorescence images of Plefl/fl and PleΔIEC distal colon (upper panels) and small intestine (lower panels) sections immunolabeled for K8 (green) and Itgα6 (red); Hoechst-stained nuclei (blue). Arrowheads, Itgα6-positive clusters. Scale bar, 25 μm. Boxed areas show ×1.5 images. Drawn schematics depict aligned, BM-attached Plefl/fl IECs (upper panel) and mislocalized, detaching PleΔIEC IECs (lower panel). B Cell lysates, cytosol fractions, and keratin-enriched high salt extracts (HSE) were prepared from WT and KO Caco-2 cells and subjected to immunoblotting with antibodies to Itgβ4 and K8. GAPDH, loading control. Graphs show relative band intensities normalized to average Plefl/fl values, n = 4–6. C Viability of WT and KO Caco-2 cells exposed to uniaxial cyclic stretch presented as a percentage of dead (PI-positive; PI+) cells, n = 9–11. D Quantification of WT and KO Caco-2 cell viability (left) and adhesion (right) under radial shear flow shown as a percentage of dead and detached cells, respectively, n = 6. Boxplot data represent median, 25th, and 75th percentile with whiskers reaching the last data point. E Adhesion strength between ECM-coated superparamagnetic beads and WT and KO Caco-2 cells was quantified using magnetic tweezers that generated forces ramps at a speed of 1 nN/s up to a maximum force of 15 nN. Image and schematic depict magnetic tweezer setup. Arrowhead, paramagnetic bead; asterisk, magnetic tweezer tip; dotted circular line, cell border. Scale bar, 20 μm. The graph shows the percentage of beads (n = 103 WT, 109 KO cells) that remained adherent at a given pulling force. The boxplot shows the distribution of the median detachment force (calculated from bootstrapping by sampling with replacement, n = 1000 runs) and its distribution (25th, and 75th percentile with whiskers reaching the minimum and maximum sampled values). Bar graph data in all other subplots represent mean ± SEM, n.s. not significant, *P < 0.05, †P < 0.001.

