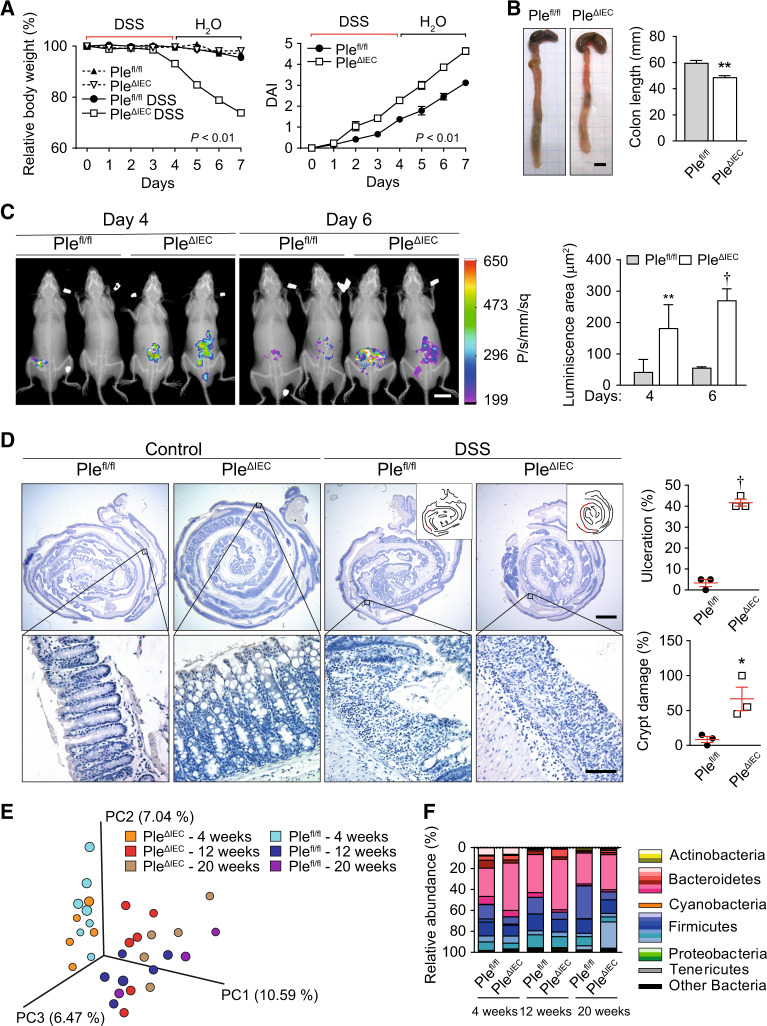
Fig. 6. PleΔIEC mice are more susceptible to DSS-induced colitis.
A Relative bodyweight and disease activity index (DAI) of untreated and DSS-treated Plefl/fl and PleΔIEC mice during experimental colitis. Four to seven mice per genotype and time point were analyzed. B Representative images of colon and caecum of DSS-treated Plefl/fl and PleΔIEC mice. The graph shows colon length, n = 4–6. C In vivo chemiluminescence images and signal quantification (graph) of DSS-treated Plefl/fl and PleΔIEC mice injected with the myeloperoxidase substrate luminol on days 4 and 6 of DSS treatment, n = 3–4. D Representative hematoxylin-stained sections of Swiss roll mounts from untreated (control) and DSS-treated (DSS) mice. Scale bars, 2 mm, magnified boxed areas, 100 μm. Insets, outlines of lesions (in red) distributed along mucosa (black lines) in corresponding panels. Graphs show quantification of colonic tissue damage given as the percentage of ulceration and crypt damage, n = 3, E, F Fecal microbiota beta diversity in 4-, 12-, and 20-week-old untreated Plefl/fl and PleΔIEC mice as determined by 16S rDNA sequencing. Principal coordinate analysis plot (E), constructed with unweighted UniFrac distance metric, shows clustering of microbial beta diversity. PC1, PC2, and PC3 represent the top three principal coordinates that captured most of the diversity (given as a percentage). Global composition (F) of bacterial microbiota at phyla level shown as relative operational taxonomic unit (OTUs) abundance per time point and genotype, n = 4–6. Data are presented as mean ± SEM, *P < 0.05, **P < 0.01, †P < 0.001.

