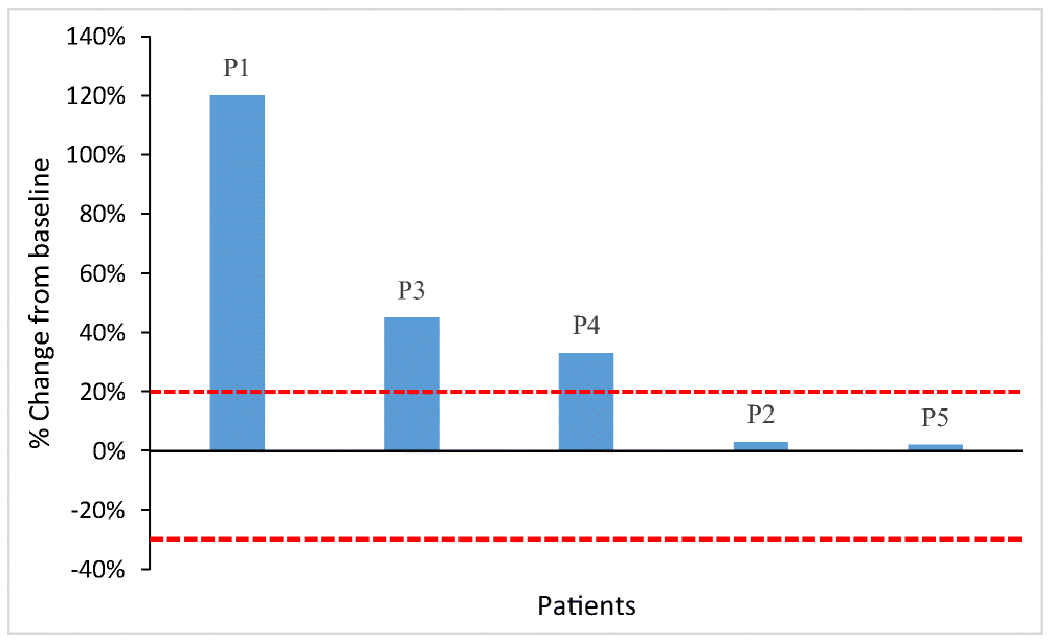
Fig 1:

Radiologic response to pembrolizumab in patients with granulosa cell tumor of the ovary. Waterfall plot illustrating the best objective response to pembrolizumab in the 5 patients (P1—5) using irRECIST criteria. Each bar represents a patient and shows the maximum percentage change from the baseline in the sum of the longest diameters of all target lesions and any new lesions while on pembrolizumab. The area above the upper red dotted line represents progressive disease (≥ 20% increase in the sum of the diameters of the target lesions compared with the baseline). The area between the upper and lower red dotted lines represents stable disease.
