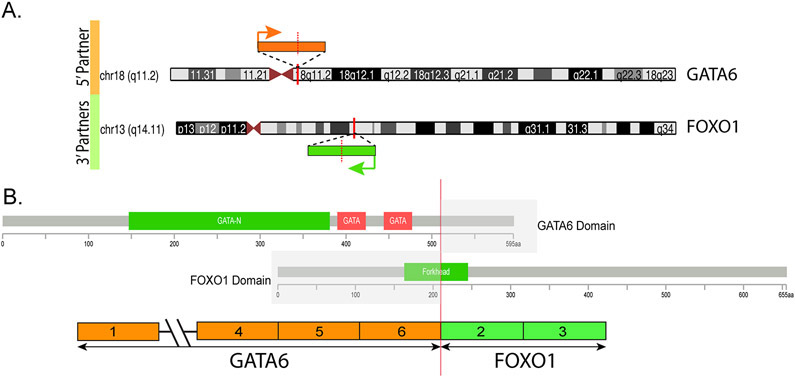
Figure 3.
A. Diagrammatic representation of the chromosomal locations of GATA6 on 18q11.2 and FOXO1 on 13q14.11. Vertical red bars indicate the exact genomic break, while orange and green arrows indicate the direction of transcription for each gene. B. Breakpoints on the two genes (red vertical line) showing the exonic composition of the fusion transcript and the retained coding regions of the encoded fusion protein. Protein domains are also represented.

