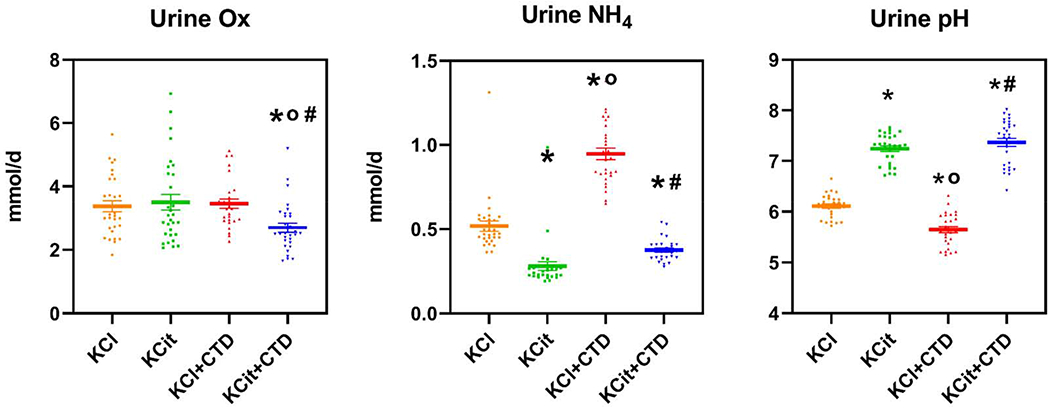
Figure 2. Urine oxalate, NH4 and pH.

Rat diets were all supplemented hydroxyproline and with either KCl (4 mmol/d) as a control, potassium citrate (KCit, 4 mmol/d), chlorthalidone (CTD, 4-5mg/kg/d)+KCl or KCit+CTD. Twenty-four hour-urine collections were done at 6, 12 and 18 wks for analysis of solute levels as described in Methods and an overall mean of all three collections was calculated. Results are mean±SE for 10 rats/group. *p<0.05 vs KCl, op<0.05 vs KCit alone, #p<0.05 vs CTD alone.
