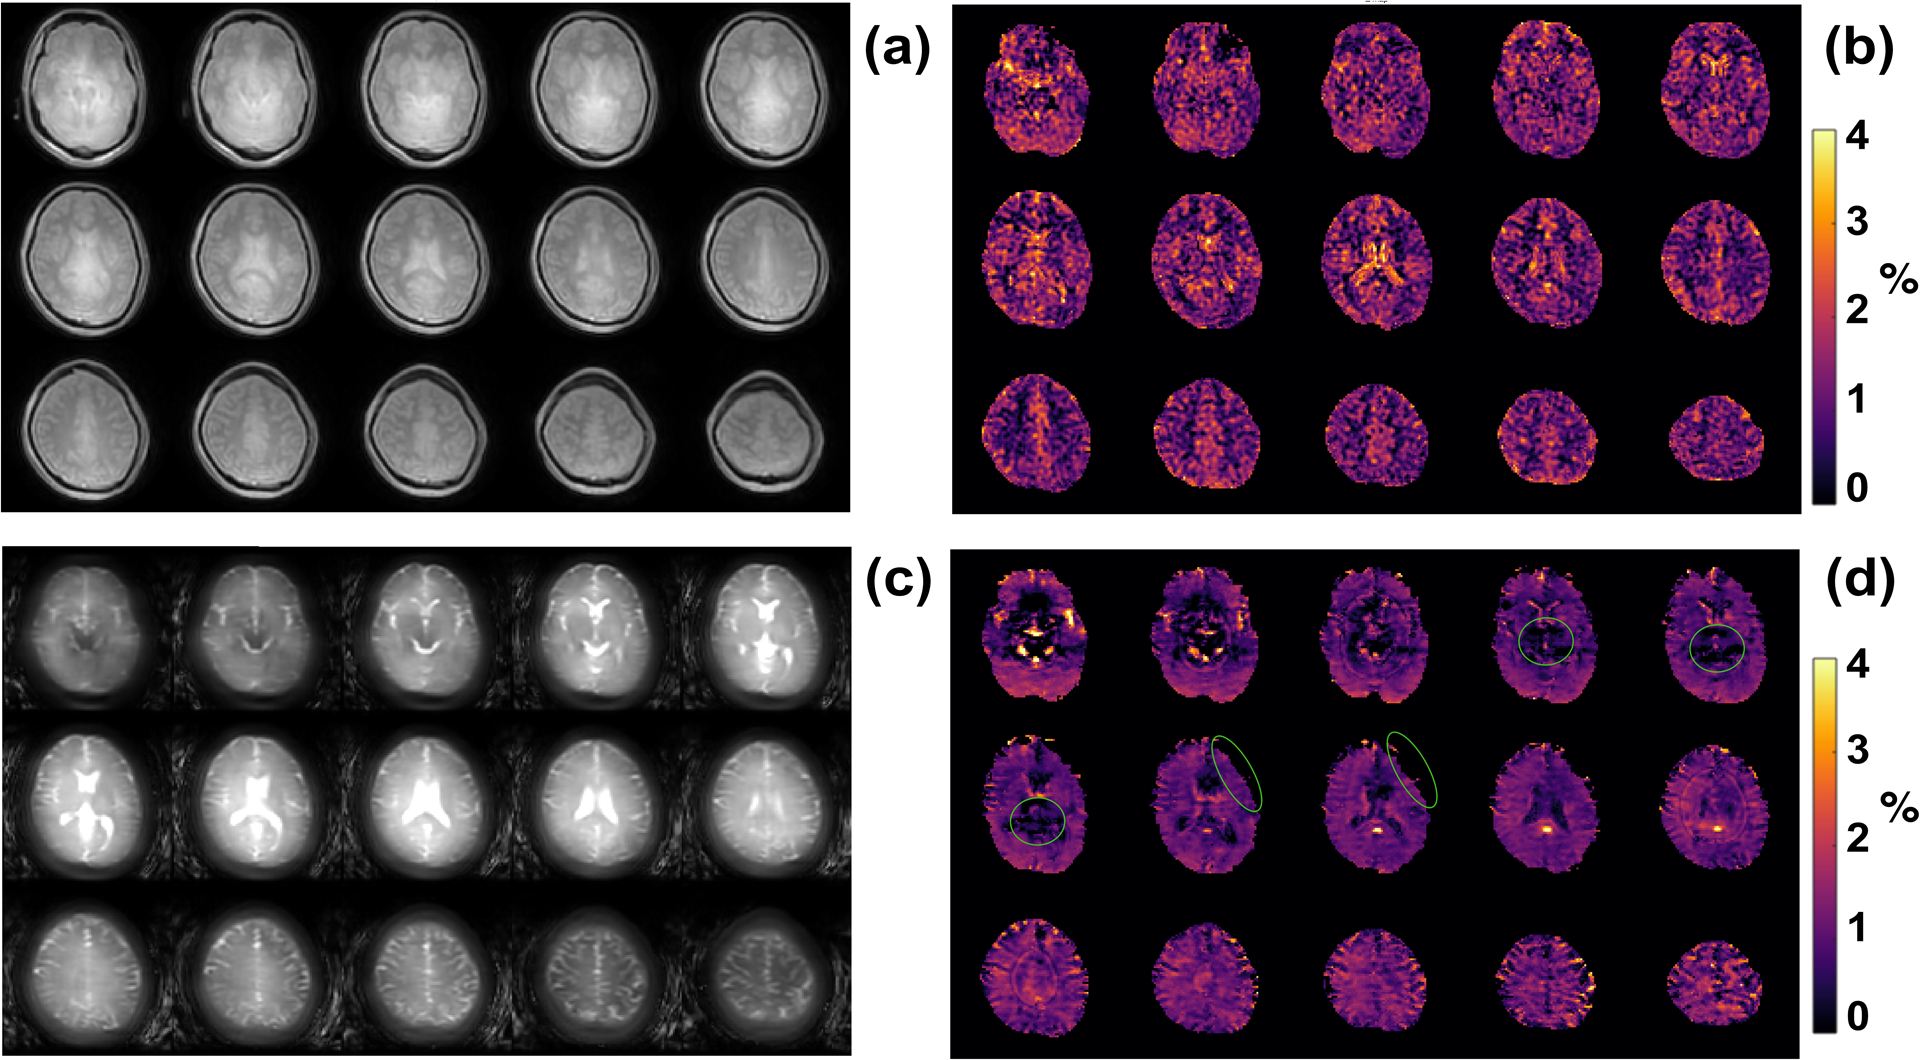
Figure 6:

Comparison of the human brain images acquired at 3T with the multi-slice starCEST (a) and 3D TSE CEST sequence (c). The amideCEST maps extracted with the PLOF method from the multi-slice starCEST (c) and 3D TSE CEST (d) images. Hypointensity regions in the amideCEST maps due to the brain motions are indicated with green circles.
