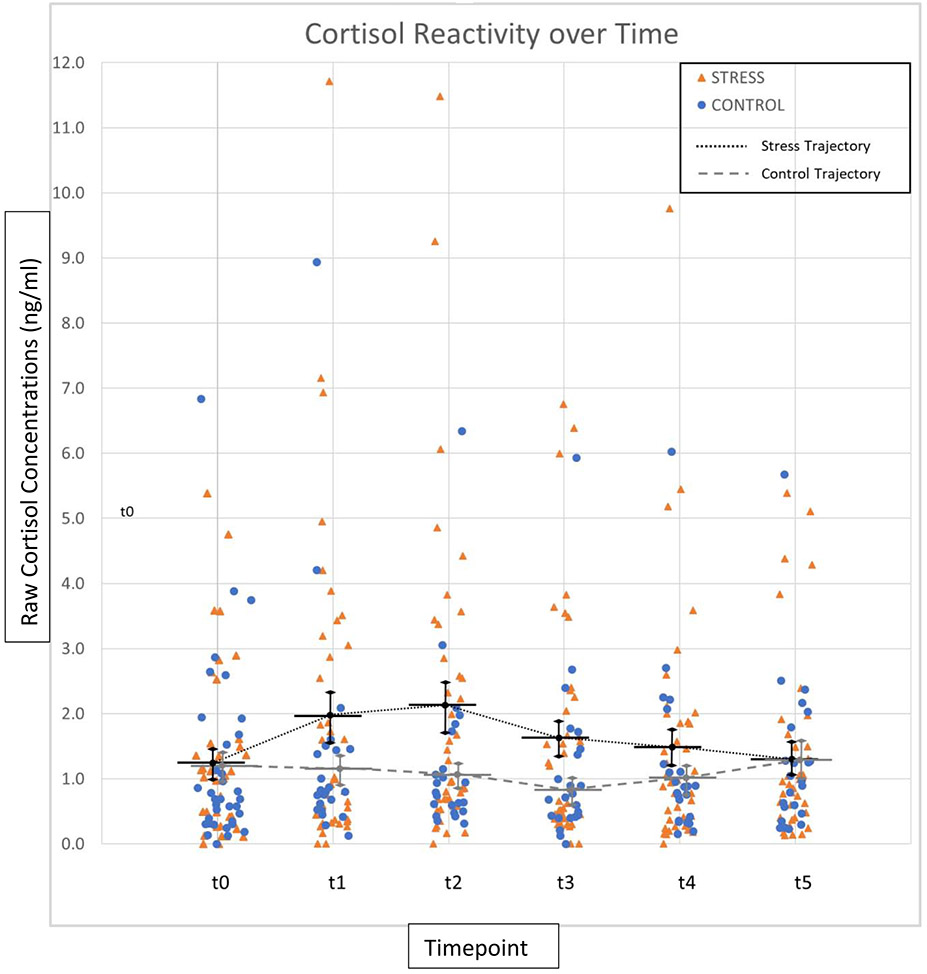
Figure 3.
Cortisol Response (ng/mol). Comparing raw salivary cortisol reactivity to stress and control conditions from baseline to 60 min after task. t0 = baseline sample, t1 = immediately post-stressor, t2 = 15 min, t3 = 30 min, t4 = 45 min, t5 = 60 min post-stressor. Orange Triangles = Stress Participants; Blue Circles = Control Participants; Black Dotted Line = Stress Group Cortisol Trajectory; Gray Dashed Line = Control Group Trajectory; Black Solid Bars = Stress Group Mean; Gray Solid Bars = Control Group Mean; Error bars = SEM

