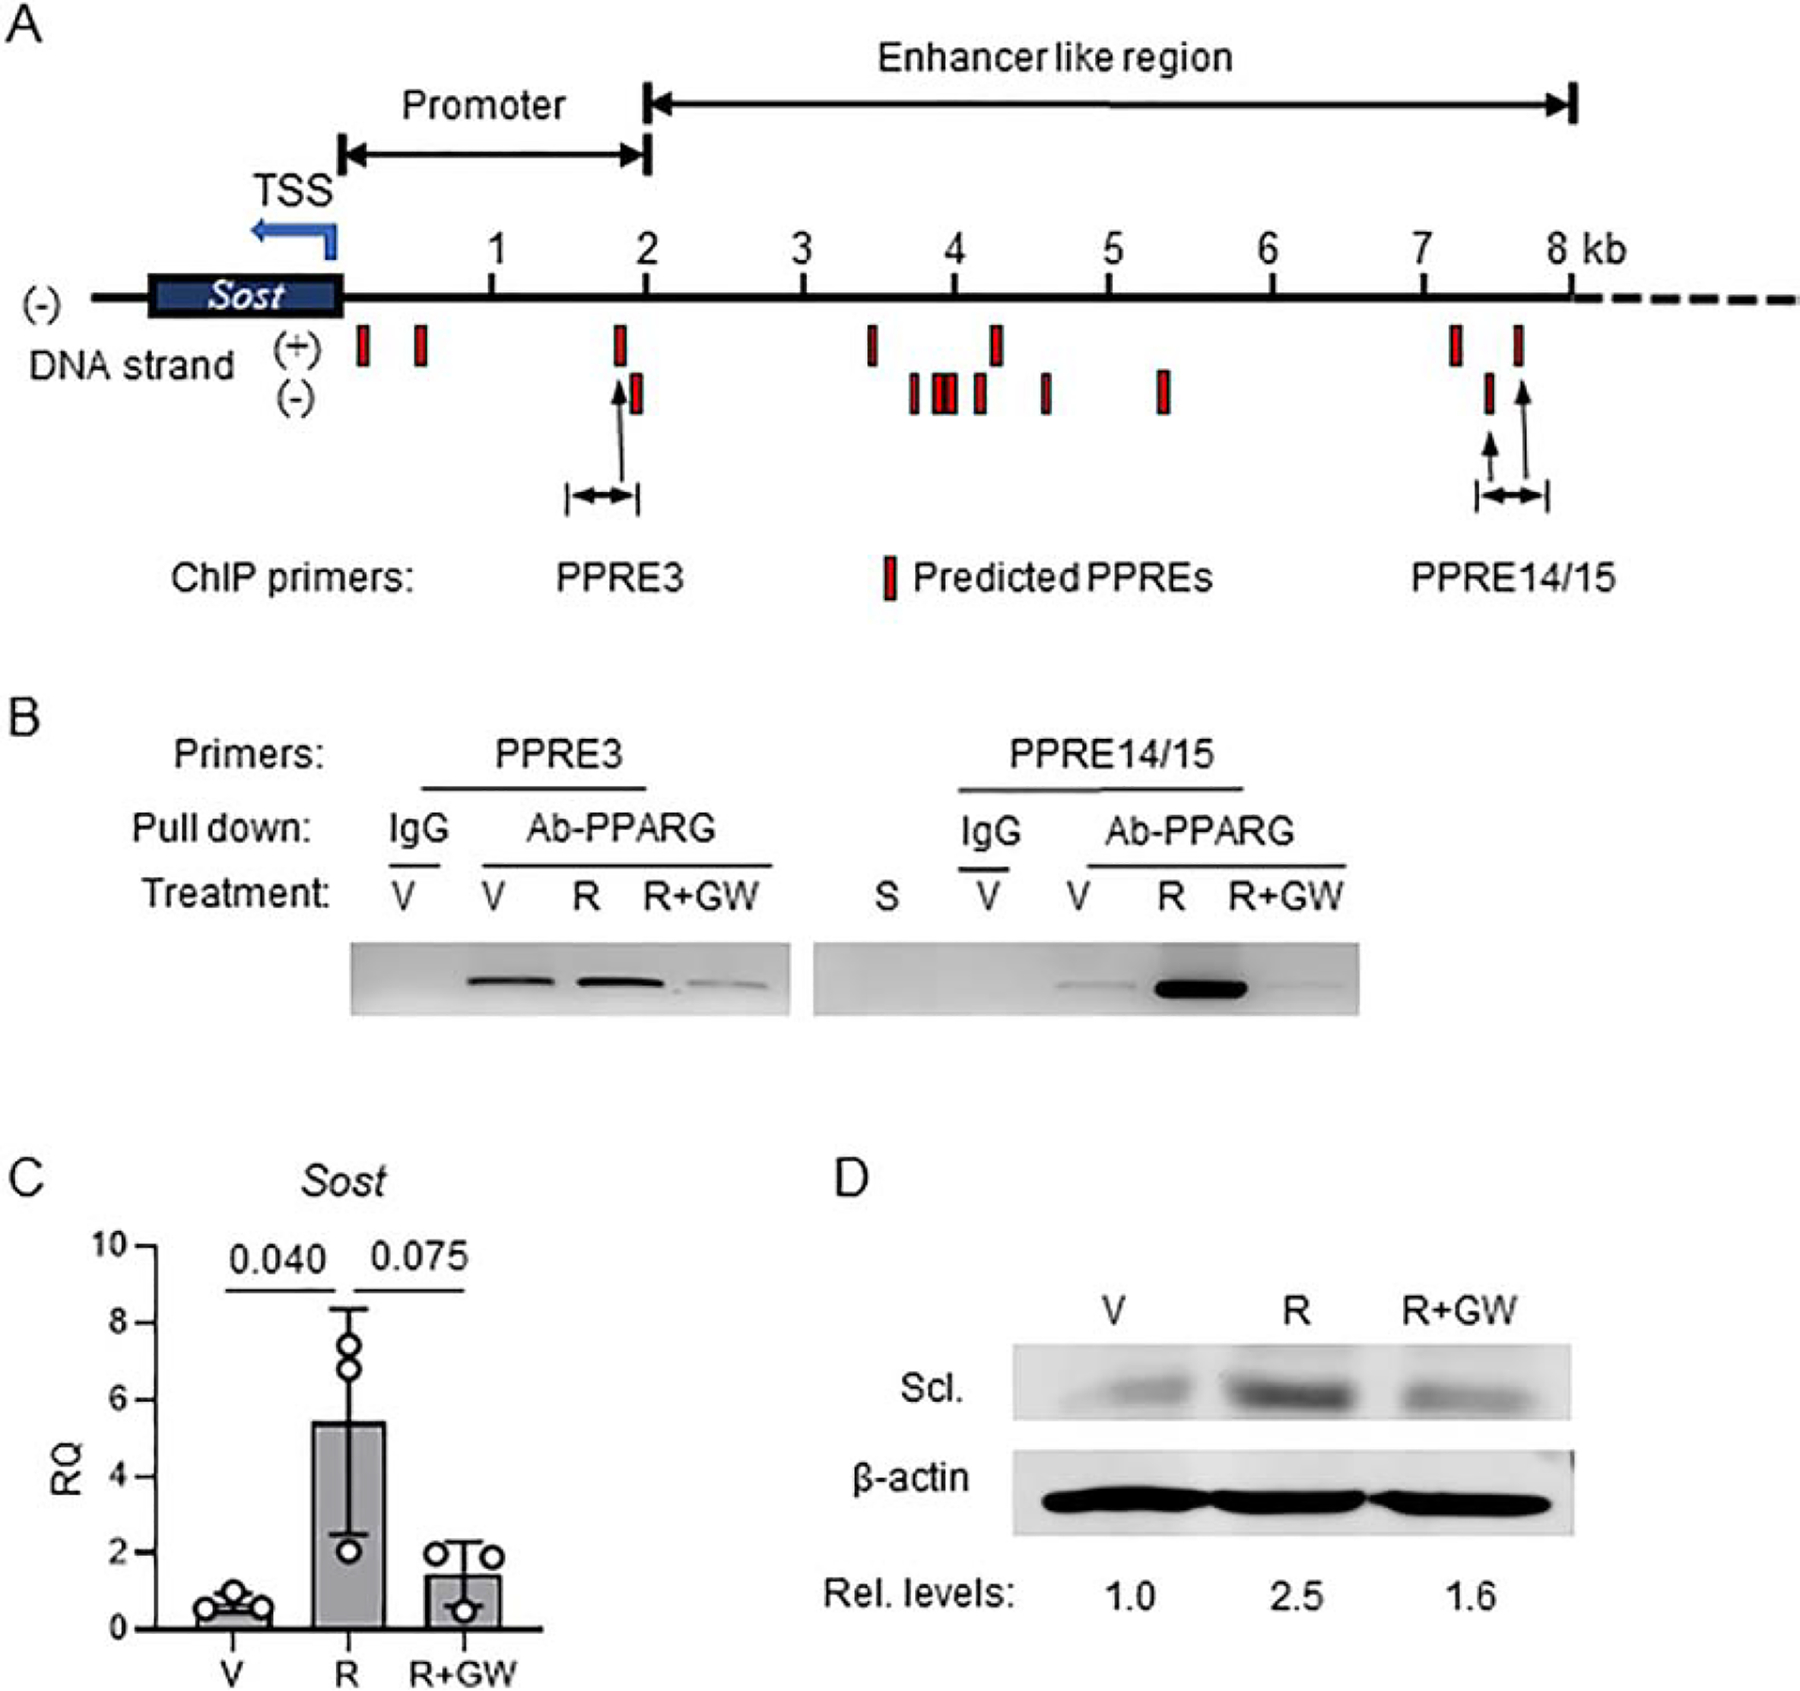
Figure 3.

PPARG positively regulates sclerostin expression. A. Schematic positioning of JASPAR projected PPARG response elements (PPREs) (red bars) upstream of sclerostin transcription start site (TSS). B. Chromatin immunoprecipitation (ChIP) assay end point agarose gel image (full image of the gel is presented in Suppl. Fig. 1). ChIP was performed on osteocyte-like MLO-Y4 cells targeting PPRE3 and PPRE14/15. Cells were treated for 24h with either vehicle (V), or 1μM rosiglitazone (R) or combination of 1μM R and 10μM GW9662 antagonist (R+GW) followed by ChIP assay, as described in Material and Methods. S – sonicated lysate (no antibody pulldown). C. Expression of Sost mRNA in MLO-Y4 cells treated for 3 days with either vehicle (V), or rosiglitazone (R), or combination of rosiglitazone and GW9662 (R+GW) at the same concentration as in (B). One-way ANOVA followed by Tukey’s post hoc analysis was performed for significance calculation. D. Western blot of sclerostin protein levels in MLO-Y4 cells treated as in (C). Sclerostin protein levels were normalized to β-actin levels measured as band density using Image J and relative levels of expression had been calculated and shown below Western blot images.
