Figure 5.


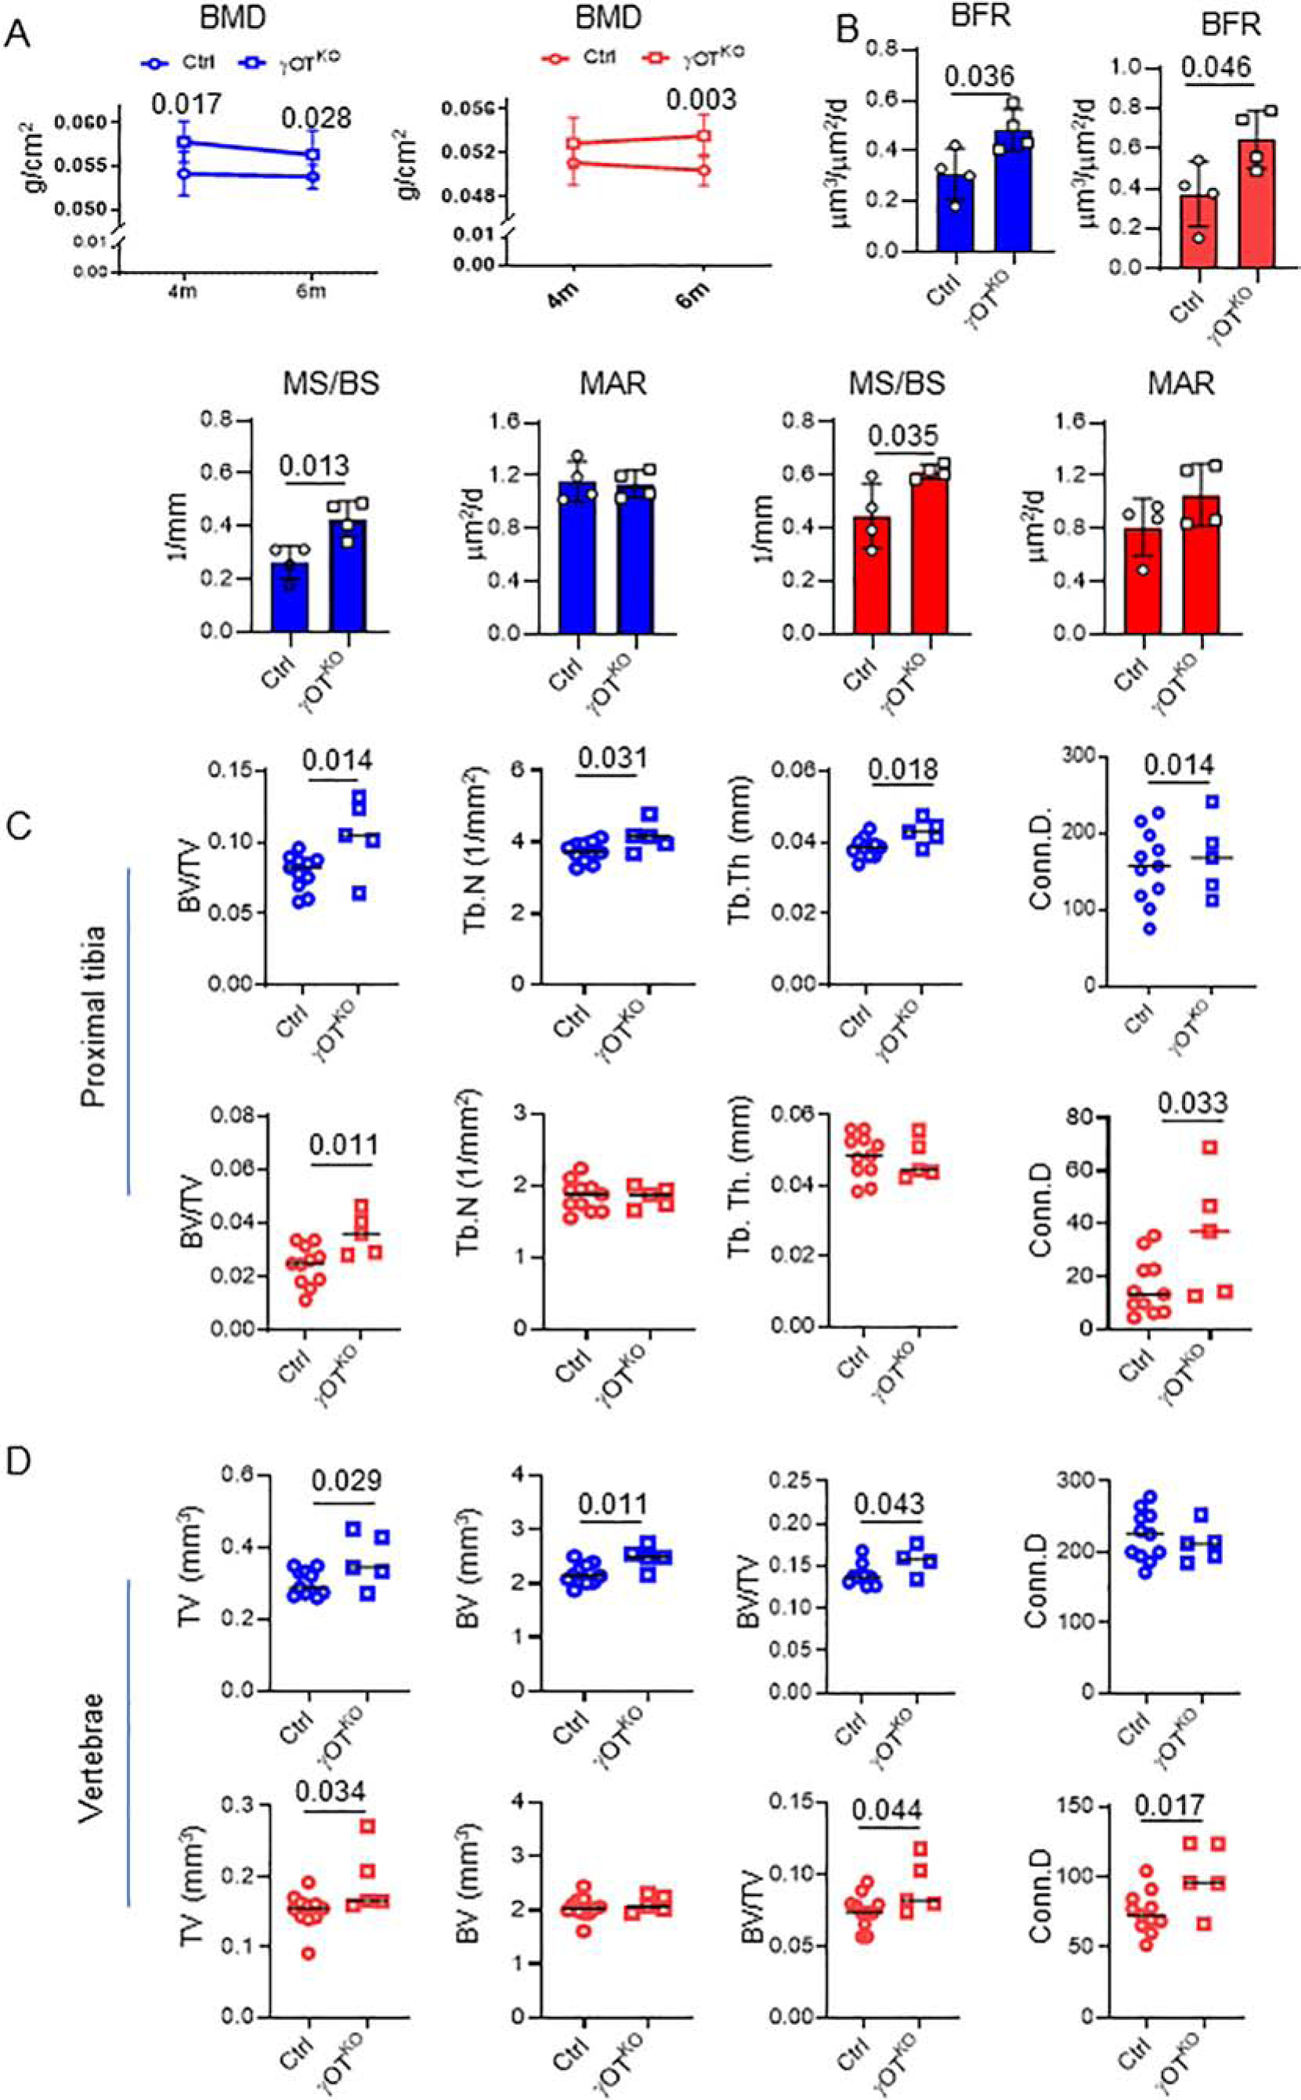
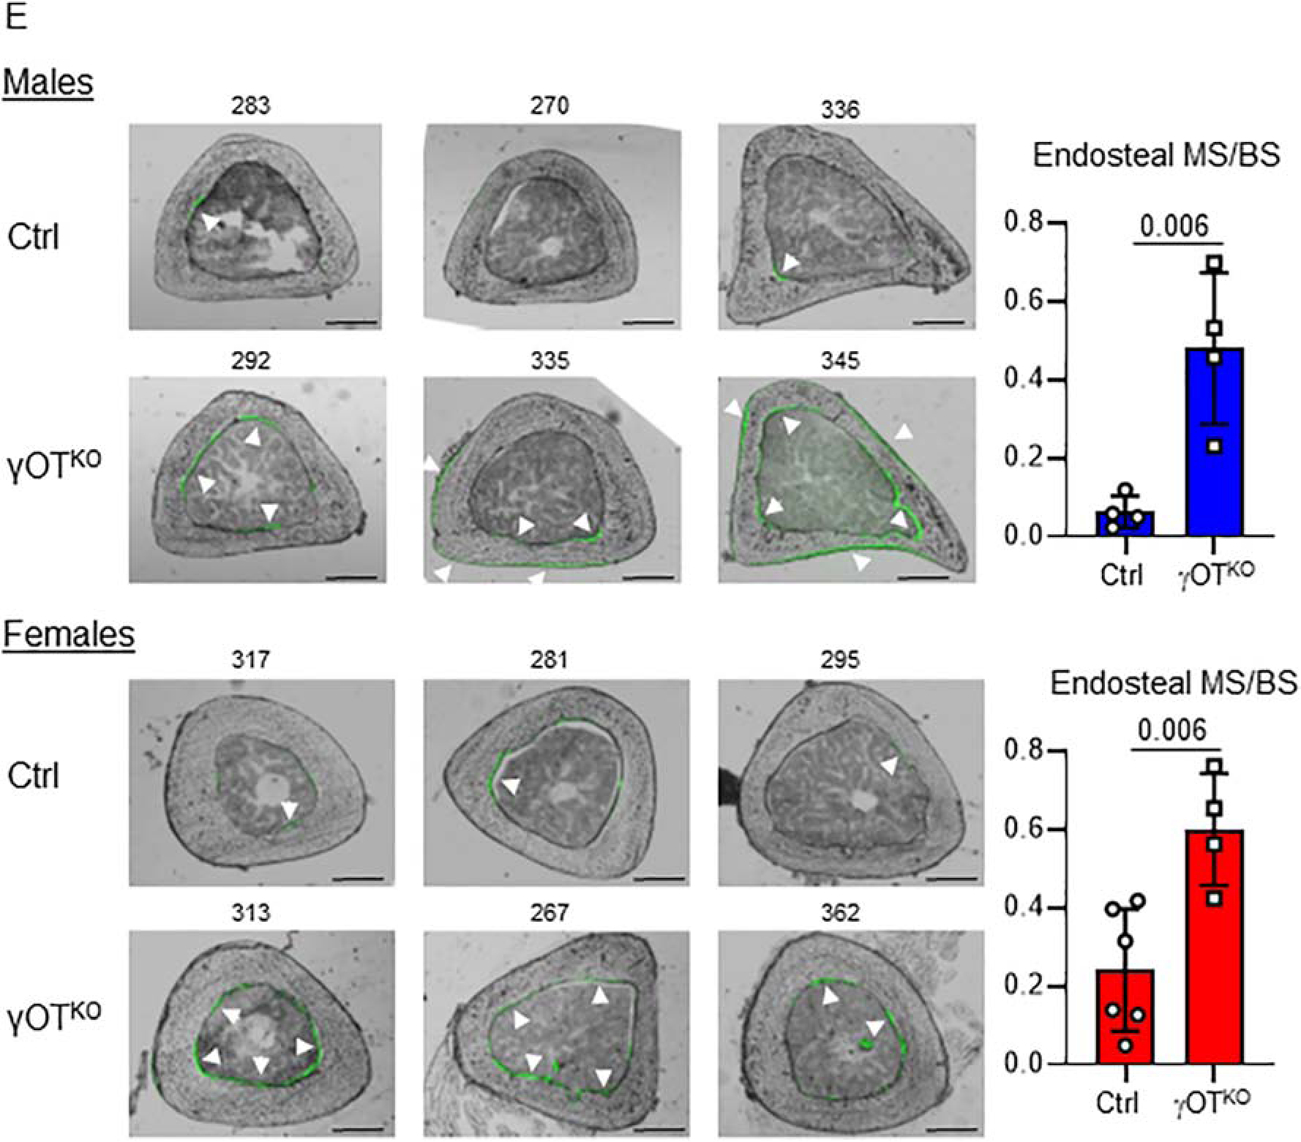
Both males (blue) and females (red) γOTKO mice exhibit high bone mass and high bone formation. A. Measurements of global BMD using DXA at 4 mo and 6 mo of age. Ctrl (n=11) and γOTKO (n=5). B. Bone formation rate (BFR), fraction of mineralizing bone surface (MS/BS), and mineral apposition rate (MAR) in 6.5 mo old males and 7 mo old females measured in calcein double-labeled tibia. Ctrl (n=4) and γOTKO (n=4). C. μCT measurements of trabecular bone in proximal tibia. D. μCT measurements of trabecular bone in L4 vertebrae. C and D. Ctrl (n=11) and γOTKO (n=5). TV – tissue volume, BV – bone volume, BV/TV – trabecular bone mass, Tb.N – trabecular number, Tb.Th – trabecular thickness, Conn.D – connectivity density. Statistical significance was calculated using parametric unpaired Student’s t test. E. Fluorescence and bright fields overlayed images of cross-sectioned tibia midshaft of the same animals as in (B). Numbers above the images indicate mice IDs. Note the correlation between very low sclerostin levels in OT of γOTKO mice (#335, 345, 292) in Fig. 2A and 2B and high calcein labeling on endosteal and periosteal tibia bone surface of the same mice. In contrast, very low calcein labeling of cortical bone corresponds to normal sclerostin levels in Ctrl mice (#283 and 270) as shown in Fig. 2A and 2B. White arrows point to calcein labeled bone surface. Scale bars correspond to 500 μm. Graphs represent quantification of endosteal mineralized surface of males (blue) (Ctrl n=4; γOTKO n=4) and females (red) (Ctrl n=6; γOTKO n=4). Statistical significance was calculated using parametric unpaired Student’s t test.
