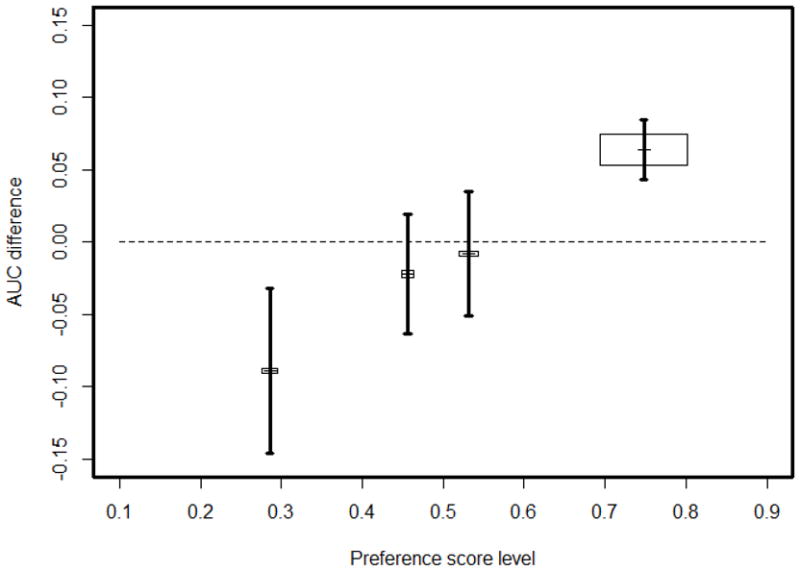
Figure 3.

The AUC differences, standard error (SE) and predicted preference score in 4 terminal nodes of the final tree. The center coordinates of the box for node h are (v̂,Δθ̂) in h, the height and width are proportional to n0 (h) and n1 (h), the area of the box is weight in weighted stratified AUC calculation; the vertical line cross the box is the interval (Δθ̂ − SE, Δθ̂ +SE).
