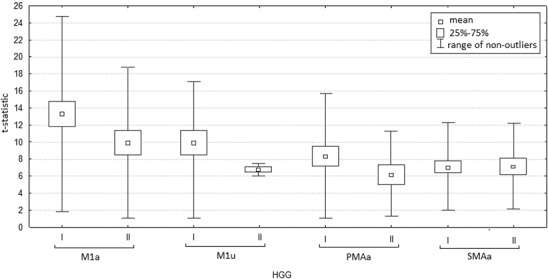
Fig. 3.

Values of t-statistics in analyzed motor areas in fMRI examinations. I—Before operation. II—After operation. M1a contralateral primary motor area, M1u ipsilateral primary motor cortex, PMAa contralateral premotor area, SMAa supplementary motor area
