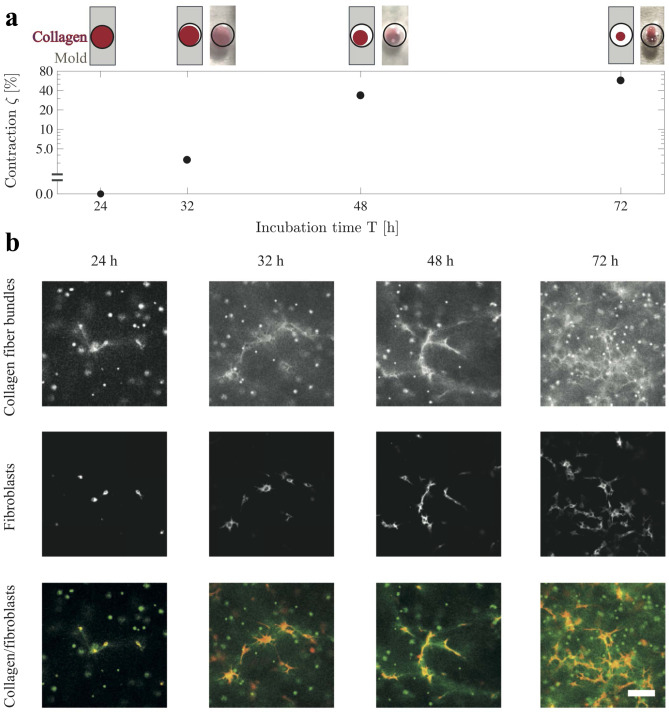
Fig. 3.
Baseline results of fibroblast–collagen contraction obtained at the level of macroscale contraction and microscale structural changes. a Fibroblast-induced collagen contraction, with post-measurement photos and sketches of sample cross section (diameter 3.0 mm at T=0 h). b Confocal images illustrate the increasing amount of collagen fiber bundles and their alignment during incubation. The top row shows confocal reflectance images of collagen fiber bundles. The middle row presents fluorescence images for the location of membrane-stained fibroblasts in respect to the collagen fiber bundles. The bottom row presents the composite images of the top and the middle rows. The scale bar denotes for 100 m

