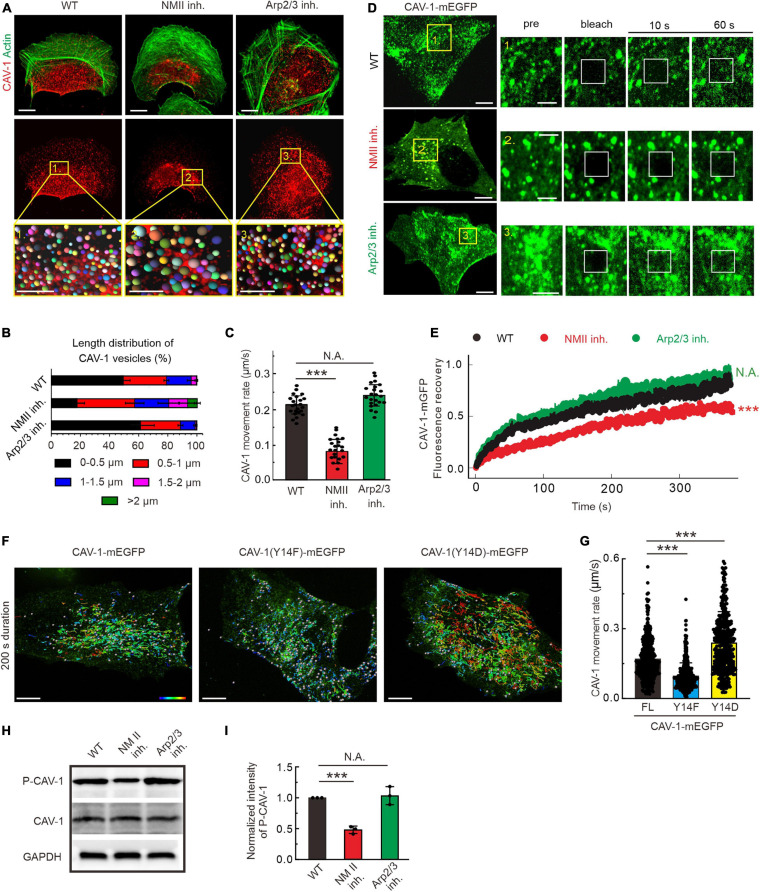
FIGURE 2.
The organization, dynamics and phosphorylation of CAV-1 are regulated by contractile actin assemblies. (A) Immunofluorescence staining of endogenous F-actin and CAV-1 vesicles in wild type (WT), myosin II inhibition (NMII inh.) and Arp2/3 complex inhibition (Arp2/3 inh.) cells, respectively. The representative analysis of CAV-1 positive dots detected by Imaris of magnified yellow boxes 1, 2, and 3 on the top panels are marked as balls which are randomly colored on the lower panels. The size of the color balls indicates the calculated sizes of CAV-1 vesicles. Bars, 10 μm (in cell images) and 5 μm (in the magnified box). (B) The length distribution of CAV-1 vesicles. The number of vesicles in each group of size is divided by the total CAV-1 number of the same cell. n = 25,602 vesicles from 32 WT cells, 13,456 vesicles from 31 myosin II inhibition cells, and 26,103 vesicles from 29 Arp2/3 complex inhibition cells. (C) Quantification of the movement rate of CAV-1 vesicles in wild-type (n = 26), myosin II inhibition (n = 22), and Arp2/3 complex inhibition (n = 23) cells. (D) FRAP analysis of CAV-1-mGFP dynamics in WT, NM II inh. and Arp2/3 inh. cells. Magnified regions represent time-lapse images of the bleached regions. Bars, 10 μm (in cell images) and 5 μm (in the magnified time-lapse image). (E) Normalized average FRAP recovery curves of CAV-1-mEGFP in WT (n = 23), NM II inh. (n = 22), and Arp2/3 inh. (n = 22) cells. (F) The representative 200 s duration dot tracking analysis of mEGFP tagged CAV-1, CAV-1(Y14F) and CAV-1(Y14D) vesicles in CAV-1 KO cells by Imaris. Color-coded bar from blue to red indicates the tracked mean speeds ranging from 0 to 0.4 μm/s. Bars, 10 μm. (G) Quantification of the movement rate of CAV-1 positive vesicles. n = 419/496/432 vesicles from 10 CAV-1/CAV-1(Y14F)/CAV-1(Y14D)-mEGFP expressing cells. (H,I) Western blot analysis (H) and quantifications (I) of phosphorylated CAV-1 (Tyr14) (compared to total CAV-1) in WT, NM II inh. and Arp2/3 inh. cell lysates. The obtained intensity value from wild-type cells was set to 1. n = 3. Data in panel (C,G,I) are presented as mean ± SD. ***P ≤ 0.001; N.A., not significant (one-way ANOVA). All the data are from three independent experiments.

