FIGURE 4.
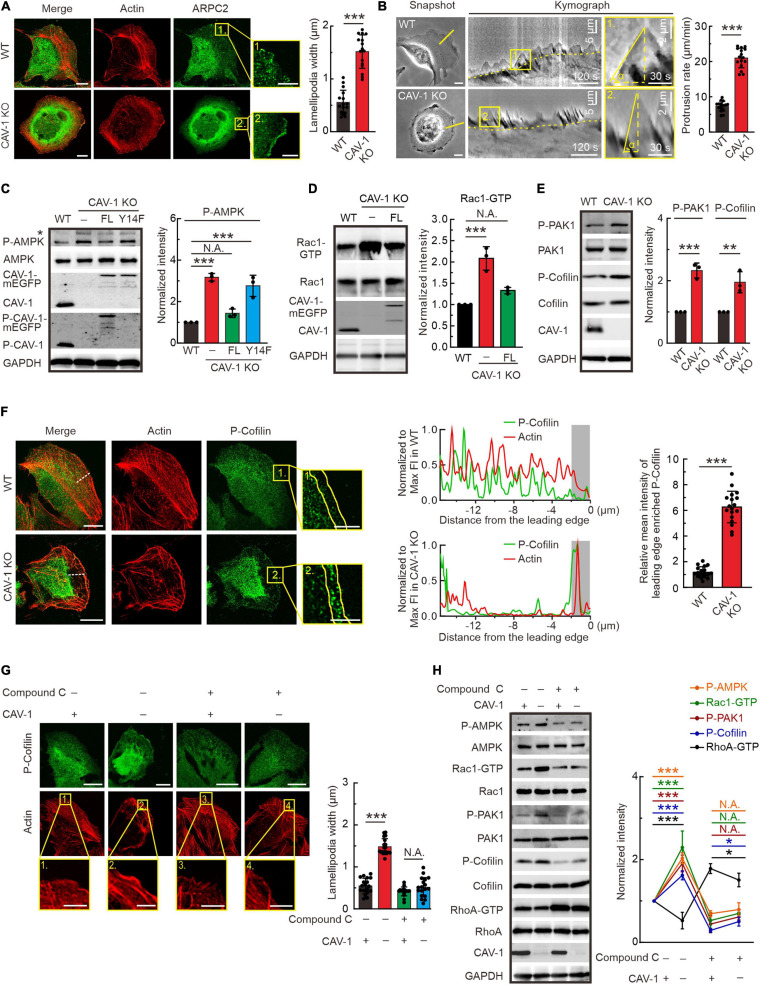
Actin protrusive network is upregulated by AMPK-Rac1-PAK1-Cofilin signaling cascade in cells lacking CAV-1. (A) Immunofluorescence microscopy analysis demonstrating that more pronounced endogenous ARPC2 colocalizes with F-actin (visualized by Alexa 568 phalloidin) on the lamellipodia protrusions in CAV-1 deficient cells. Magnified regions of cell edges on the right show the distribution of ARPC2 in WT and CAV-1 KO cells. Bars, 10 μm (in cell images) and 5 μm (in the magnified box). Quantification of width of lamellipodial protrusions are shown on the right. n = 16 regions from 16 cells for each group. (B) Representative images of membrane ruffling by time-lapse microscope. 1-pixel-wide areas were cut out to generate a 300 frame 2 s interval kymograph. Yellow dashed lines indicate the track of cell movement. An enlarged region is displayed on the right, vertical dashed lines show the membrane protrusion distance, while horizontal dashed lines mark the duration of protrusion. Bars, 10 μm (in cell images) and 2 μm (in the magnified box). Quantification of protrusion rate are shown on the right. n = 16 regions from 16 cells for each group. (C) P-AMPK (Thr172) and total AMPK were detected from the lysates of each group by western blotting. Please note that CAV-1(Y14F)-mEGFP can’t be detected by using phospho-CAV-1(Tyr14) antibody. Asterisk denotes the non-specific band. Quantification of P-AMPK (Thr172) levels (compared to total AMPK) from each group was shown on the right panel. n = 3. (D) Pull-down assays were performed for WT, CAV-1 KO, and CAV-1 KO; CAV-1-mEGFP re-expressed cells. Proteins bound to GST-PAK binding domain were analyzed by western blots and further quantified (compared to total Rac1) based on the band’s intensity. n = 3. (E) Western blot analysis and quantification (compared to total PAK1 and Cofilin) of the levels of phosphorylated PAK1 (Thr423) and Cofilin (Ser3) in WT and CAV-1 KO cell lysates. n = 3. (F) Immunostaining and quantification of endogenous P-Cofilin (Ser3) and F-actin distribution in WT and CAV-1 KO cells. A 16 μm length line was used to generate a line profile to illustrate the co-localization of P-Cofilin (Ser3) and F-actin. The lamellipodia region was enlarged on the right, and 2 μm width region was chosen to analyze the mean intensity of P-Cofilin (Ser3) on the leading edge. Bars, 10 μm (in cell images) and 5 μm (in the magnified box). n = 18 regions from 18 cells for each group. (G) Immunostaining and quantification of endogenous P-cofilin (Ser3) distribution upon compound C treatment in WT and CAV-1 KO cells. Magnified regions represent the lamellipodia region. Bars, 10 μm (in cell images) and 5 μm (in the magnified box). n = 18 regions from 18 cells for each group. (H) Western blot analysis and quantification of the phosphorylated levels of AMPK (Thr172), PAK1 (Thr423), Cofilin (Ser3) and activity of Rac1 and RhoA upon compound C treatment. n = 3. In panel (C–E,H), the obtained intensity value from wild-type cells was set to 1. All the data are presented as mean ± SD. In (C,G,H), ***P < 0.001; *P < 0.05; N.A., not significant (one-way ANOVA). In (D–F), ***P < 0.001; **P < 0.01 (unpaired t-test). All the data are from three independent experiments.

