Figure 3.
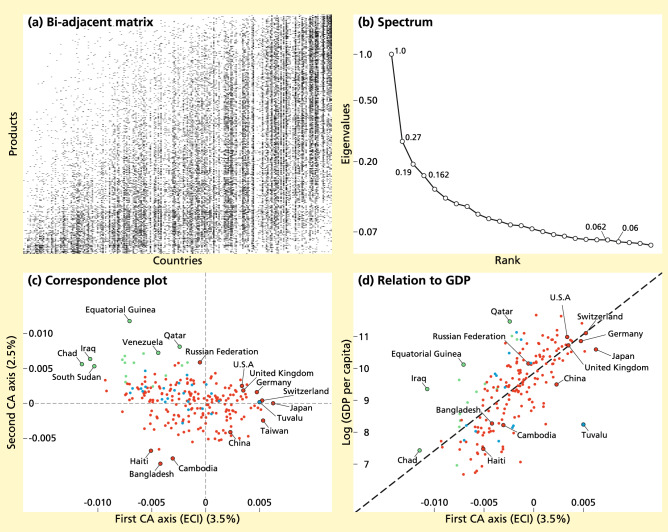
Results of applying CA to the country-product matrix. (a): The country-product incidence matrix shows a triangular structure. Column and rows are sorted by the first CA axes, known as ECI and PCI for the country and the product similarity matrices, respectively. (b): Sorted spectrum for the country-product matrix (log-scale). The slow decay and lack of clear gaps in the spectrum suggests a high-dimensional, homogeneous dataset. Numerical labels are reported for the first four eigenvalues, and for the twenty-first and twenty-second (the small gap between the latter two motivated the choice of a twenty-dimensional embedding in the final part of the analysis) (c): Correspondence plot showing the first (horizontal) and second (vertical) CA axes for the country similarity matrix. The first CA axis is known as the ECI, and explains for the total variation. The second axis explains of total variation and seems to distinguish countries specializing in garments and textiles from other countries. Colors indicate the obtained clusters when running k-Means with on the embedding spanned by the first 20 CA axes. (d): GDP per capita as a function of the first CA axis (ECI). The dashed line is the linear regression of log(GDPpc) with ECI (=0.49). Colors indicate the same clusters as in c). The analysis was performed using our SCCA R package21.

