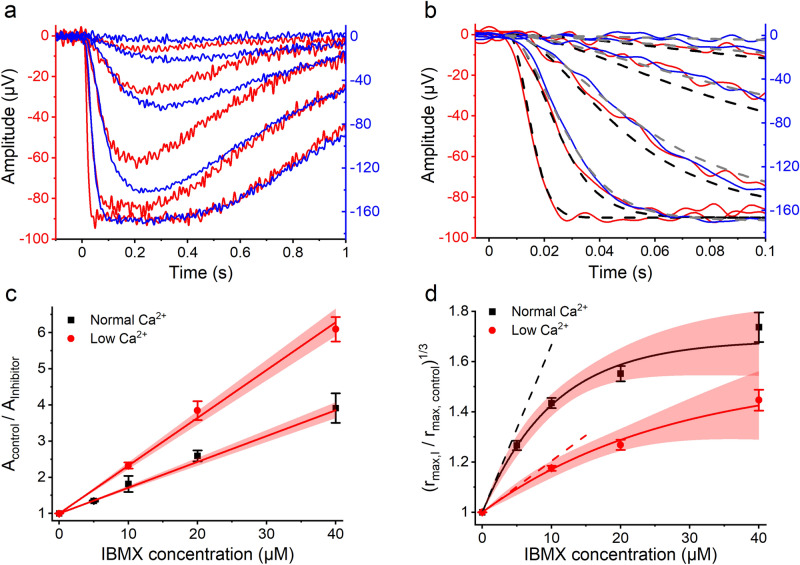
Figure 4.
(a) Response families recorded in low Ca2+ solution without IBMX (red traces) and with 40 µM IBMX (blue traces). The flash strengths were 3.42, 13.6, 54.1, 216, and 858 R*rod−1 in both solutions and responses are averages from 1 to 3 repetitions. (b) Determination of amplification constants for response families shown in Fig. 4a by fitting the flash response model to the response leading edge (Eq. (15)) to the activation phase of the responses. τR was locked to 26 ms and τPDE to 199 ms, which was determined separately for the concerned retina from Pepperberg plot. Constant delay of 7 ms was used for the fits. Fitting gave an amplification constant of 27.7 s−2 in low Ca2+ without IBMX (black dashed lines) and 4.9 s−2 in 40 µM IBMX (gray dashed lines). (c) Determination of inhibition constant against light-activated PDE6 (KI,light). Fitting of Eq. (8) to the pooled data gave an inhibition constant of 13.9 µM and 7.6 µM for normal and low Ca2+, respectively. The intercept of the linear fit is fixed to 1. (d) Determination of inhibition constant against basally activated PDE6 (KI,dark). The figure shows the relative increase in the maximal LERG-OS amplitude right after the light turn-off in the cGMP clamp (see Fig. 3). The exponential fits to the cGMP clamp data extrapolated to zero inhibitor concentration gave 15.0 µM and 49.0 µM for KI,dark in normal and low Ca2+, respectively (see Eq. (11)).

