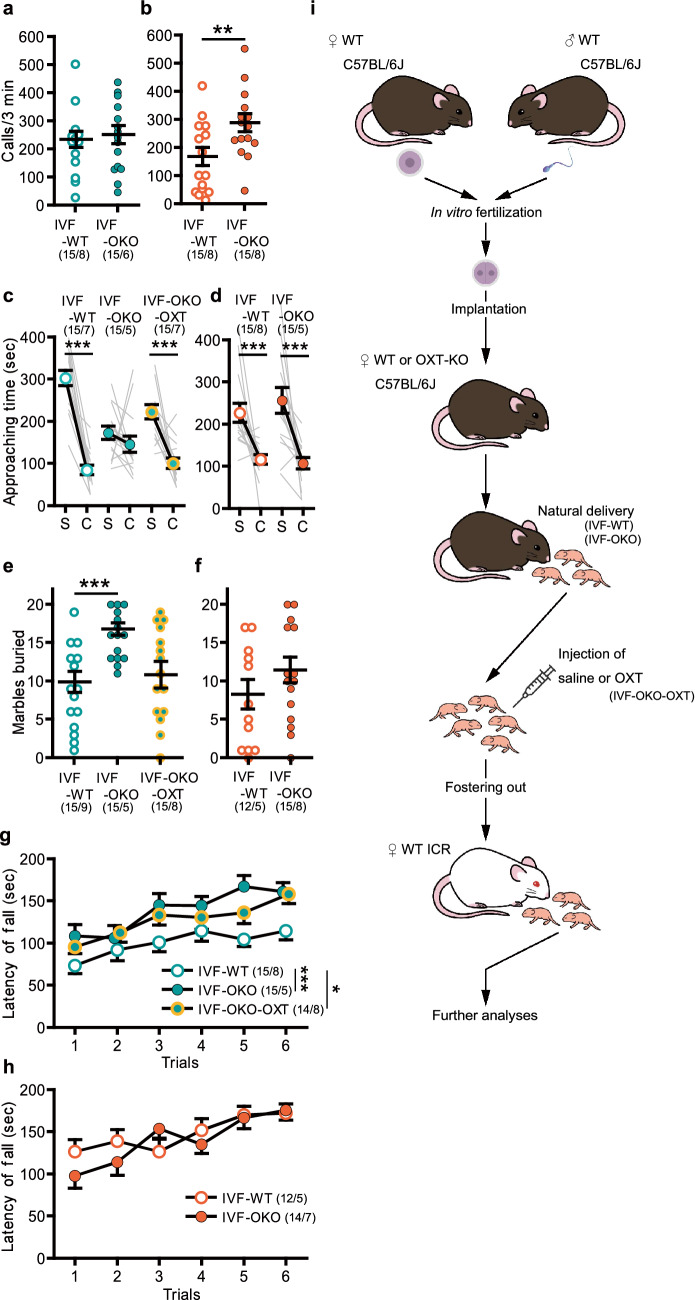
Figure 3.
Effects of a lack of maternal OXT on the offspring. (a,b) Number of USV calls at PD 8. [(a) male, in vitro fertilization [IVF]-wild-type [WT] vs. IVF-OXT-knockout [OKO]: p = 0.681, (b) female, IVF-WT vs. IVF-OKO: p = 0.006]. (c,d) Approaching time to the stranger cage (S) and the empty cage (C) in the 3-CSI test. [(c) male, IVF-WT: p < 0.001, IVF-OKO: p = 0.124; IVF-OKO-OXT: p < 0.001, (d) female, IVF-WT: p < 0.001; IVF-OKO: p < 0.001]. (e,f) Number of marbles buried in the MB test. [(e) male, IVF-WT vs. IVF-OKO: p = 0.001, IVF-WT vs. IVF-OKO-OXT: p = 0.492, (f) female, IVF-WT vs. IVF-OKO: p = 0.223]. (g,h) Latency to fall from the rod in the rotarod test. [(g) male, body weight, IVF-WT: 26.7 ± 0.33 g, IVF-OKO: 28.1 ± 0.36 g, IVF-OKO-OXT: 26.7 ± 0.32 g; IVF-WT vs. IVF-OKO: p = 0.003, IVF-WT vs. IVF-OKO-OXT: p = 0.044, (h) female, two-way analysis of variance, group: F1, 24 = 0.399, p = 0.534]. (i) Schema of the procedures in this section. Data represent the mean ± standard error of the mean. The numbers in parentheses indicate the numbers of mice tested and their litters (mice/litters) in each group. *p < 0.05, **p < 0.01, ***p < 0.001.

