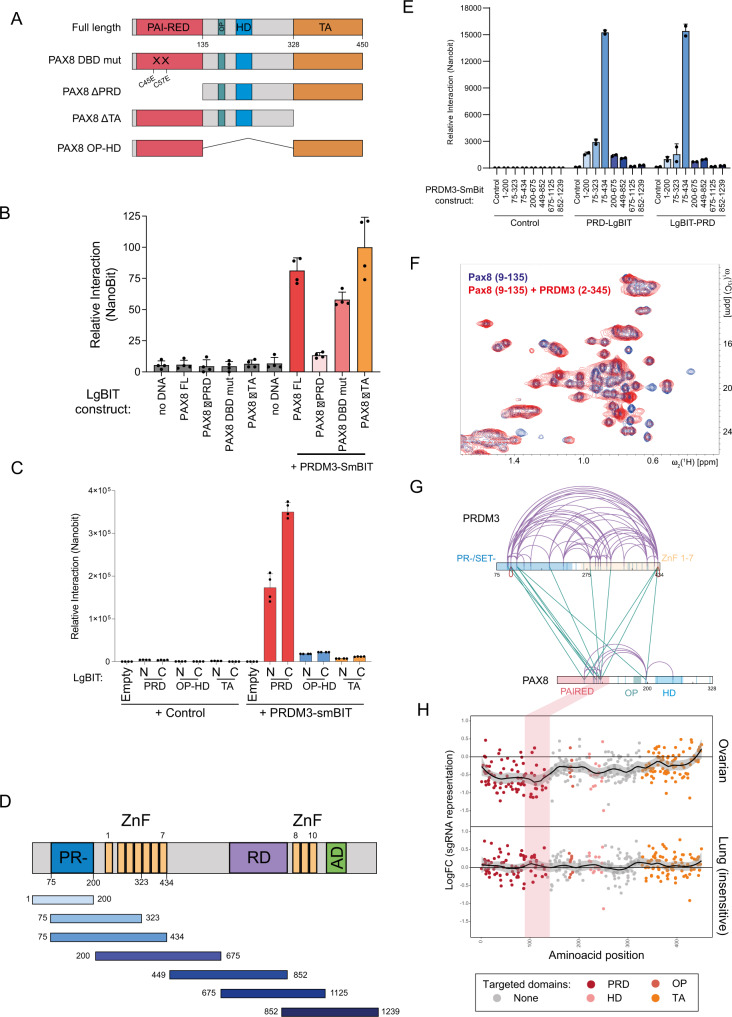
Fig. 2. Mapping of the binary interaction between PAX8 and PRDM3.
A Schematic representation of PAX8 and corresponding mutants generated by in vitro transcription–translation (IVTT). B IVTT-NanoBit assay testing the interaction of PAX8-LgBit and truncation mutants with PRDM3-SmBit. Data are presented as mean ± SD from four biological replicates. C NanoBit assay testing the interaction of individual PAX8 domains with PRDM3-SmBit. N/C N-terminal and C-terminal tagging. Data are presented as mean ± SD from four biological replicates D Schematic representation of PRDM3 and corresponding protein fragments generated by IVTT. E NanoBit assay testing the interaction of PRDM3-SmBit protein fragments with the PAIRED domain of PAX8. LgBit-PRD/PRD-LgBit, N-terminal/C-terminal tagging. Data are presented as mean ± SD from two technical replicates from a representative experiment out of three independent experiments. F Overlay of the methyl region of 2D [13C,1H]-HMQC spectra of uniformly 13C,15N-labeled PAX8(9–135) in the absence (blue) and in the presence of unlabeled PRDM3 (2–345) at equimolar concentration (red). G Crosslinking-MS results from PAX8 (2–328) and PRDM3 (75–434). Intramolecular interactions are marked in purple and intermolecular interactions in green. Vertical blue bars inside protein diagrams represent the position of lysine residues and shaded regions represent domain boundaries. H CRISPR-Tiling screen data in OV56 (ovarian) and NCI-H1299 (lung) cell lines. Each dot represents a single sgRNA, and color coding is based on targeting a specific domain in PAX8 protein. Shaded vertical bar represents region enriched in intramolecular crosslinks from (G) corresponding to second helical portion of PAX8 DBD (called –RED). Source data for Western blots and interaction measurements are provided as a Source Data file.

