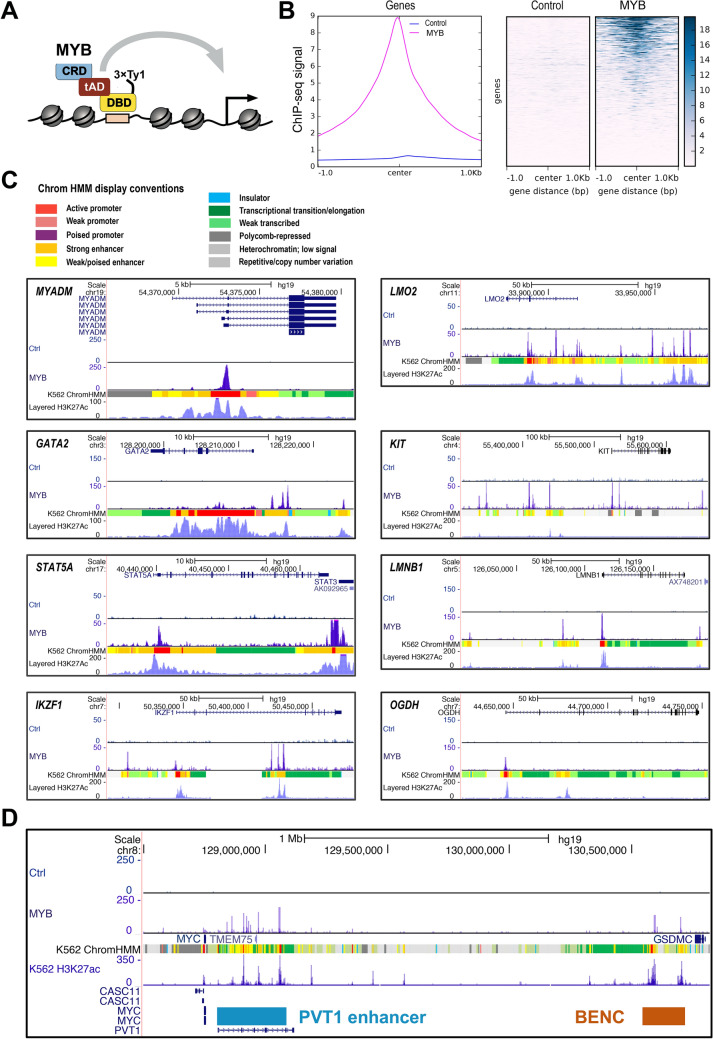
Figure 1.
MYB occupies genomic loci of its target genes. (A) Model showing the full length MYB with N-terminal 3×Ty1-tag used to generate the current MYB ChIP-seq data from K562 cells. In the model the N-terminal DNA binding domain (DBD), the central transactivation domain (tAD) and the C-terminal regulatory domain (CRD) of MYB are shown. (B) An average ChIP-seq signal in K562 cells both from the control cell line and the stable cell line expressing N-terminally 3×Ty1-tagged full length MYB. Left panel shows a line plot showing the intensity of MYB ChIP-seq signals centred at the TSS of all genes. The heatmap shows average ChIP-seq signals at and ± 1 kb around the TSS of all genes. We used Ensembl human reference genome annotation (GRCh37 release 87) as regions for calculating the ChIP-seq signal enrichment at and ± 1 kb around the TSS. The line plot and heatmap were made using deepTools2 v3.3.077. (C) UCSC tracks showing MYB occupancy at genomic loci of some of previously reported MYB target genes. MYB ChIP-seq peaks at the promoter regions of STAT5A, MYADM and OGDH and MYB ChIP-seq peaks both at the promoter and nearby or distal enhancer regions of LMO2, KIT, LMNB1, and IKZF1 loci along with K562 chromHMM chromatin segmentation tracks are displayed. Color guide for display conventions used by chromHMM is provided. (D) MYB occupancy at MYC locus. Myb ChIP-seq peaks show occupancy at BENC and PVT1 enhancer regions located downstream of the MYC gene. Visualization of the tracks were made using the UCSC genome browser76 (https://genome.ucsc.edu/) by creating a UCSC session containing the K562 control and MYB ChIP-seq bigwig files from the current study.

